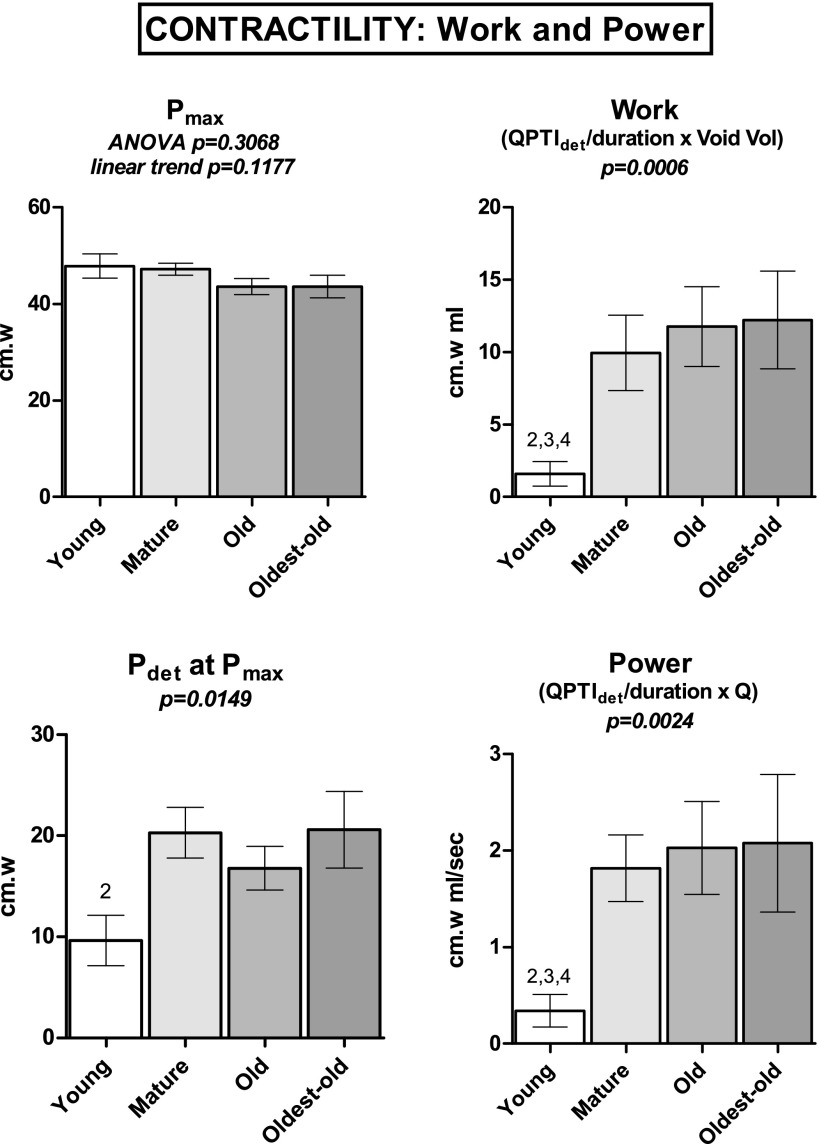
Fig. 5.
Maximum pressure and calculated power and work indices were obtained during continuous-fill cystometry under urethane anesthesia. Pressure component of power and work calculations obtained by dividing detrusor PTI during flow (QPTI) by duration of flow. Bars show means ± SE. ANOVA was used where noted; otherwise, a Kruskal-Wallace test was performed. 2P < 0.05 vs. Mature. 3P < 0.05 vs. Old. 4P < 0.05 vs. Oldest-old. P for linear trend is reported where applicable.

