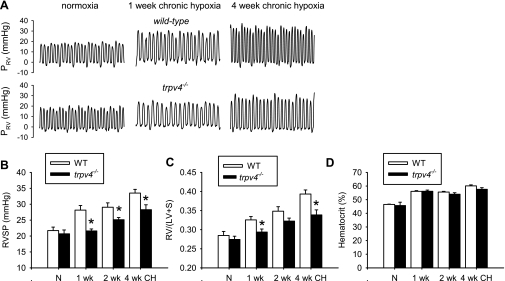
Fig. 9.
Comparison of hypoxia-induced pulmonary hypertension in wild-type (WT) and trpv4−/−mice. A: representative tracings of right ventricular pressure (PRV) recorded in wild-type and trpv4−/− mice exposed to normoxia or 10% O2 for 1 and 4 wk. Mean group data of right ventricular (RV) systolic pressure (RVSP; B), RV to left ventricle and septum mass ratio [RV/(LV + S)] (C), and hematocrit (D) measured from wild-type and trpv4−/− mice after 1, 2, and 4 wk are shown. There were 5–9 mice in each group. *Significant difference between trpv4−/− and wild-type mice.

