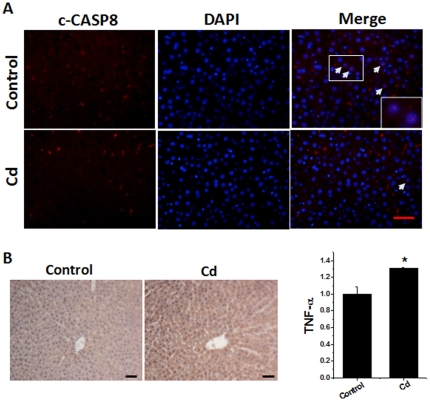
Figure 3. Expression of CASP8 and TNF-α in rat livers.
Hepatic tissues were collected from the rats as described in Figure. 1. Cleaved-CASP8 (c-CASP8) was examined by double immunofluorescent staining for c-CASP8 as red and nuclei by DAPI as blue (A). The sections from these rats were also stained for TNF-α by immunohistochemical staining with semi-quantitative analysis (B), as described in Materials and Methods. Bar = 50 µm. Data was presented as mean ± SD. *P<0.05 vs control.

