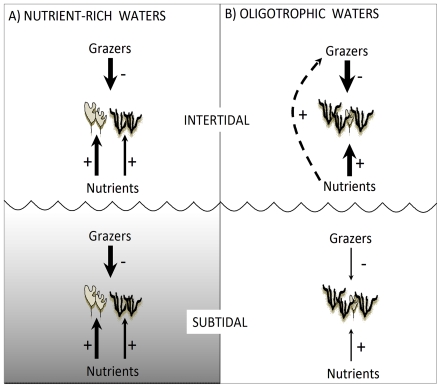
Figure 8. Diagram showing the relative role of nutrients (bottom-up) and grazers (top-down) in intertidal and subtidal habitats in (A) nutrient-rich and (B) oligotrophic waters.
Arrows show direct (solid line) and indirect (dashed line), positive (+) and negative (−) effects. The thickness of the arrows reflects their strength. Black, bushy drawings represent algal turfs, grey leafy drawings represent foliose macroalgae.

