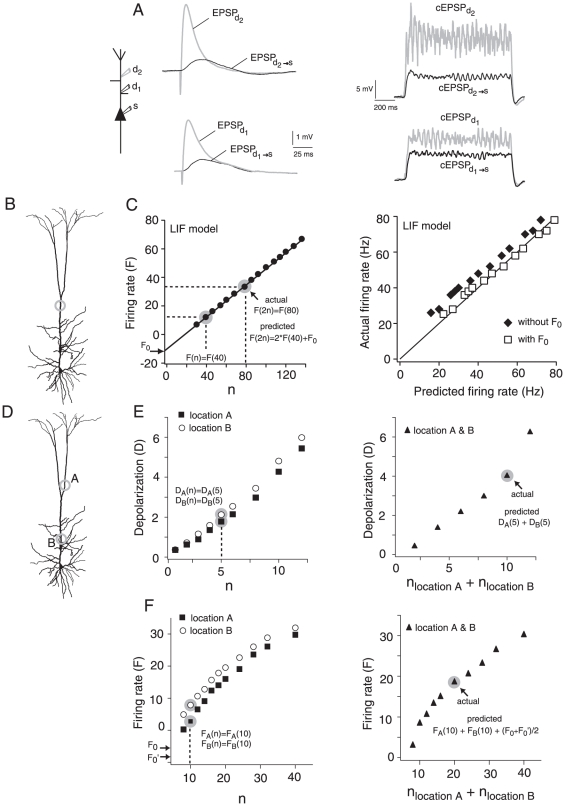
Figure 1. Matching EPSPs and calculating the linearly-predicted summation of inputs.
A, left, EPSPs recorded at the sites of injection (EPSPd1, EPSPd2) and at the soma (EPSPd1→s, EPSPd2→s). Electrodes at d1 and d2 were placed 150 µm and 334 µm, respectively, from the soma. Right, Depolarizations (termed composite EPSPs or cEPSPs) recorded at the dendrite (cEPSPd1, cEPSPd2) and at the soma (cEPSPd1→s, cEPSPd2→s) when EPSC barrages (rate = 0.24 kHz) were injected at d1 or d2. B, Injecting the inputs at a single location to test if doubling the response evoked by n inputs equals the response to injecting 2n. C, The linear prediction of the firing rate incorporates the contribution of the inputs needed to reach threshold. Left, LIF model: the y-intercept (arrow) of the F vs. n relation was used as the correction factor (F0) for the linear prediction. Right, LIF model: plot of the actual and predicted firing rate with (□) and without (⧫) compensating for the inputs needed for threshold. D, Spatial summation: the response to inputs injected simultaneously at two separate dendritic locations (A and B) was compared to the sum of the inputs delivered individually. The total number of inputs injected at each location individually and simultaneously was identical. E, left, For spatial summation in the subthreshold range, the linear prediction was calculated by adding the depolarization measured by injecting n inputs (e.g. n = 5, points highlighted in gray) at each dendritic location individually. Right, The actual sum of the inputs was obtained by simultaneous injection of n inputs at each location (i.e. nlocationA+nlocationB = 10 in data point highlighted in gray). F, left, For suprathreshold spatial summation, the predicted firing rate was calculated by adding the firing rates obtained by injecting n inputs (e.g. n = 10, points highlighted in gray) at each location individually. The correction for voltage threshold was calculated by taking the average of the y-intercepts (F0′, F0) of the F vs. n relation for each location. Right, The actual sum of the inputs was obtained by simultaneous injection of n inputs at each location (i.e. nlocationA+nlocationB = 20, in data point highlighted in gray).

