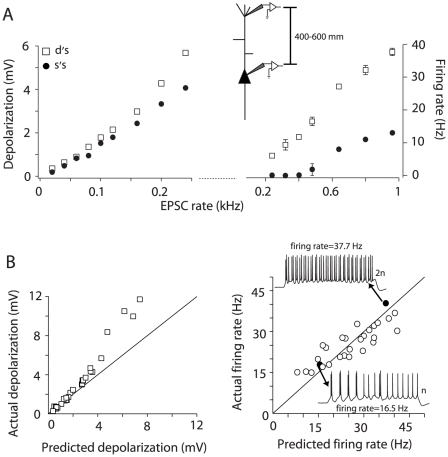
Figure 4. Integration of inputs injected at distal dendritic sites.
A, left, Depolarization vs. input rate relation for inputs injected at the soma (•) and dendrite (□, 500 µm from the soma) of the same neuron. Right, suprathreshold continuation of the input-output relation. B, Population scatter plot of the actual vs. predicted summation of subthreshold (left) and suprathreshold (right) inputs injected at distal sites (n = 8). Right, Black data points (and the corresponding spike trains) are the responses to a doubling of the input rate. The solid black line in some plots represents the unity slope.

