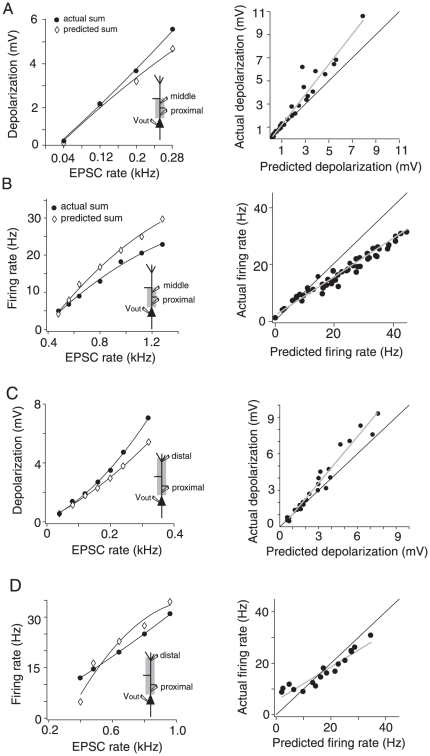
Figure 8. Integration of inputs distributed between proximal-middle (A and B) and proximal-distal (C and D) dendritic sites.
A, Left, Actual and predicted depolarization vs. input rate for one cell stimulated at 115 µm and 300 µm from the soma. Right, Population plot (n = 15) of the actual vs. predicted spatial summation of subthreshold inputs injected at proximal-middle sites. B, Left, Actual and predicted firing rate vs. input rate relation for one cell stimulated at 115 µm and 300 µm from the soma. Right, Population plot (n = 15) of the actual vs. predicted spatial summation of suprathreshold inputs injected at proximal-middle sites. C, Left, Actual and predicted depolarization vs. input rate for one cell stimulated at 100 µm and 500 µm from the soma. Right, Population plot (n = 7) of the actual vs. predicted spatial summation of subthreshold inputs injected at proximal-distal sites. D, Left, Actual and predicted firing rate vs. input rate relation for one cell stimulated at 100 µm and 500 µm from the soma. Right, population plot (n = 7) of the actual vs. predicted spatial summation of suprathreshold inputs injected at proximal-distal sites. In all single cell examples (left column) black lines are polynomial fits through the data. In all population plots (right column) black lines are the unity slopes and gray lines are best linear fit through the data points.

