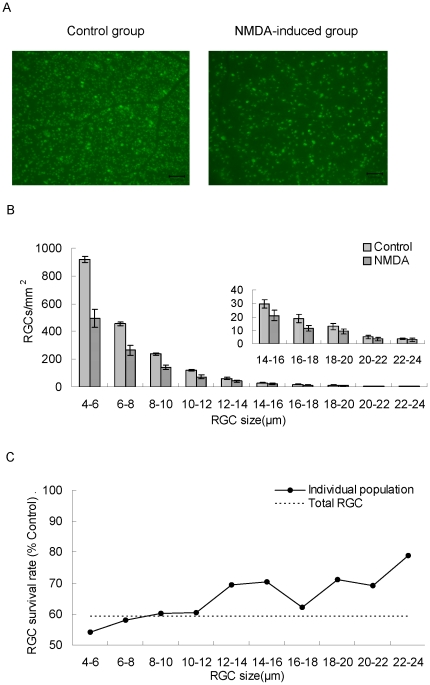
Figure 1. Flatmount quantification of rat RGCs by image analysis software.
Seven days post-treatment with intravitreal injection of vehicle (BSS as control) or NMDA solution. (A). Image of FG-labeled RGCs in flatmounted retina, bar = 100 µm. (B). Soma size distribution histograms. The histograms were generated by counting 10000 RGC cells and dividing into size groups with a 2 µm interval. RGC density was expressed as RGCs/mm2 (mean ± SEM, n = 8). (C). RGC survival rates of different size groups after intravitreal NMDA (40 mM, 2 µL) treatment. Each point represents RGC survival rate (%) based on the individual RGC size population of control group, the dashed line represents total RGC survival rate (%).

