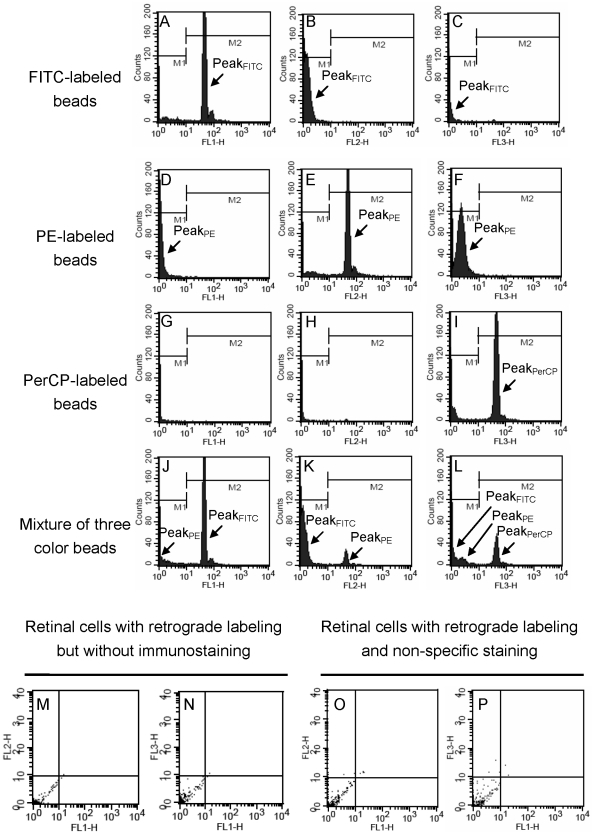
Figure 2. Preliminary analysis of flow cytometry.
(A–L) Representative flow cytometric histograms of fluorescein isothiocyanate (FITC, Ex: 490 nm; Em: 520 nm)-labeled beads (A–C), phycoerythrin-R (PE, Ex: 495 nm; Em: 578 nm)-labeled beads (D–F), peridinin-chlorophyll protein (PerCP, Ex: 490 nm; Em: 677 nm)-labeled beads (G–I) and the equal-amount mixture of three color beads (J–L). The FL-1H histogram (A) shows the positive peak of FITC-labeled beads (peakFITC) (in region M2, intensity >101); the FL-2H histogram (E) shows the positive peak of PE-labeled beads (peakPE); the FL-3H histogram (I) shows the positive peak of PerCP-labeled beads (peakPerCP). The FL-1H (J), FL-2H (K), and FL-3H (L) histograms of the mixture of three color beads show positive peaks of FITC, PE, and PerCP-labeled beads, respectively. (M–P) Representative flow cytometric dot plots of negative controls. >99.98% retinal cells with retrograde labeling but without immunostaining (M, N), and >99.90% retinal cells with retrograde labeling and non-specific staining (O, P) were in the negative region (third quadrant, both X and Y intensity <101). Abbreviations: FL1-H: green fluorescence, 530/30 nm bandpass filter; FL2-H: orange fluorescence, 585/42 nm bandpass filter; FL3-H: red fluorescence, >650 nm bandpass filter.

