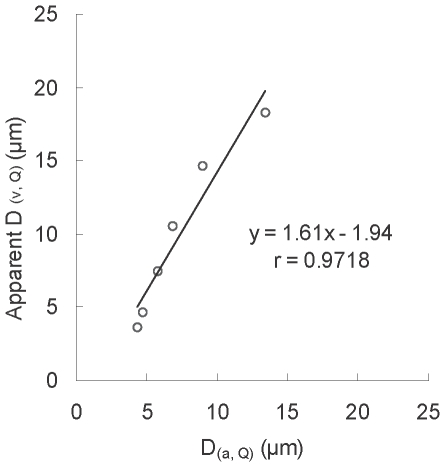
Figure 5. Linear relationship between area diameter (D(a)) and apparent volume diameter (D(v)) of normal RGCs.
D(a) was estimated by image-analysis software. Apparent (D(v)) was obtained by substituting its FSC value in the calibration curve of the standard microspheres (y = 0.027x+2.16 x = FSC value; y = diameter). (D(a, 5), D(v, 5)), (D(a, 20), D(v, 20)), (D(a, 40), D(v, 40)), (D(a, 60), D(v, 60)), (D(a, 80), D(v, 80)), and (D(a, 95), D(v, 95)) were plotted to obtain the equation: y = 1.61x−1.94. D(v, Q) and D(a, Q) represent the volume diameter and area diameter, respectively at the cumulative cell size percentile of Q in total RGCs.

