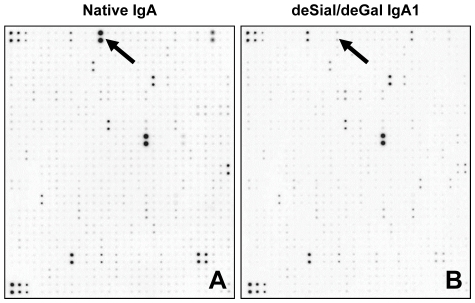
Figure 1. Cytokine array analysis after stimulation of cultured human mesangial cells (HMCs) with native IgA or deSial/deGal IgA1.
The HMCs were stimulated with native (A) or deSial/deGal IgA1 (50 µg/ml) (B) for 48 h. The culture supernatants were then applied for a protein array analysis. After incubation of samples with array membranes for 2 h at room temperature, the spots on the membranes were scanned and digitized. The signal intensities of the spots obtained from two separate experiments were analyzed. (The proteins that were up- or downregulated by approximately 2 fold are summarized in Tables 1 and 2.) The spots shown by arrows correspond to adiponectin. The intensity of the spots in the membrane stimulated with native IgA was higher than that of cells stimulated with deSial/deGal IgA1 in HMC (A, B).

