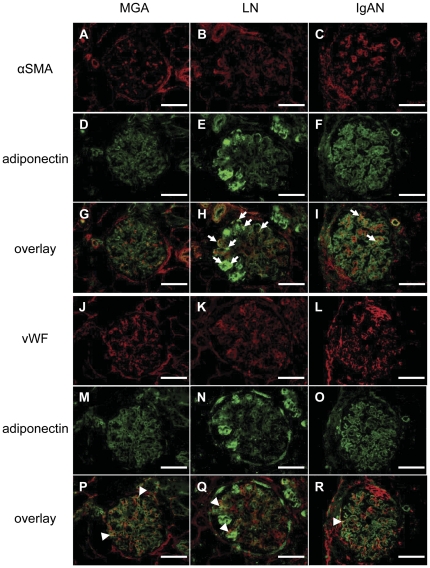
Figure 4. The expression of adiponectin, αSMA and vWF in human renal biopsies.
Immunofluorescent staining of renal biopsy specimens from patients with minor glomerular abnormalities (MGA; A, D, G, J, M and P), lupus nephritis (LN; B, E, H, K, N and Q) and IgA nephropathy (IgAN; C, F, I, L, O and R) are shown. (Upper panels) Each section was stained for αSMA (a marker of activated mesangial cells, red) (A–C) and adiponectin (green) (D–F). Some αSMA-positive cells were colocalized with adiponectin-positive cells (yellow) (G–I). Double positive areas were predominant in the glomeruli of LN patients (H, arrows) as compared to IgAN patients (I, arrows). (Lower panels) Each section was stained for vWF (a marker of endothelial cells, red) (J–L) and adiponectin (green) (M–O). Some vWF-positive cells were colocalized with adiponectin-positive cells (yellow) (P–R, arrowheads). Double positive areas predominated in the glomeruli of MGA patients (P). Strong and segmental staining of adiponectin was recognized in the glomeruli of LN patients (E and N). The adiponectin staining in the glomeruli of IgAN patients was weaker than that of LN and MGA patients. Scale bars represent 100 µm.

