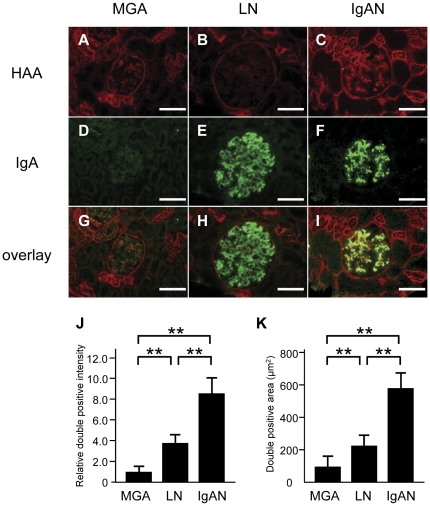
Figure 6. Double staining of HAA lectin and IgA in renal biopsy specimens, and the quantitative analysis of staining.
Renal biopsy specimens from patients with minor glomerular abnormalities (MGA) (A, D and G), lupus nephritis (LN) (B, E and H) and IgA nephropathy (IgAN) (C, F and I) were stained for HAA lectin (red) (A–C), IgA (green) (D–F) and their images were merged (yellow) (G–I). In IgAN patients, the IgA-positive areas were colocalized with HAA lectin-positive area in the glomeruli. On the other hand, there were IgA-positive areas but no HAA lectin-positive areas in the glomeruli of LN patients. The relative double positive intensities in the glomeruli of IgAN patients were increased compared to those of LN or MGA patients (J). The double positive areas in the glomeruli of IgAN patients were increased compared to those with LN or MGA (K). Note that certain segments of tubules and Bowman's capsules were also stained with HAA lectin. Each column consists of the means ± SE. MGA, n = 9; LN, n = 14; and IgAN, n = 17. **P<0.01. The scale bars represent 100 µm.

