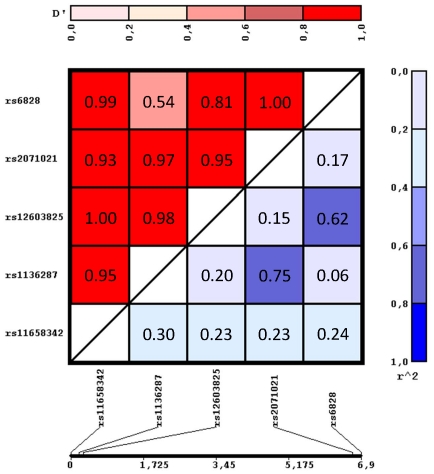
Figure 2. Linkage disequilibrium data of the five tagging SNPs derived from the overall cohort (N = 1,974).
D′-values are marked by red shadings (scale given at the top), r2-values by blue shadings (scale given to the right). The distances (in kb) between the tagging SNPs are given at the bottom of the figure.

