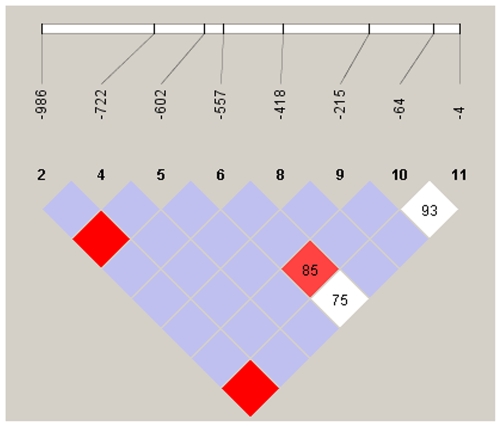
Figure 1. Haploview plot illustrating the linkage disequilibrium of the FCN2 promoter region from 40 healthy Syrian individuals.
At the top the SNPs are shown according to their succession from the start of translation of the FCN2 gene. Empty squares indicate a high degree of LD (LD coefficient D′ = 1) between pairs of markers. Numbers indicate the D′ value expressed as a percentile. Red squares indicate pairs in strong LD with LOD scores for LD ≥2; purple squares, D′ = 1 with LOD = 2; white squares, D′ <1.0 and LOD ≤2.

