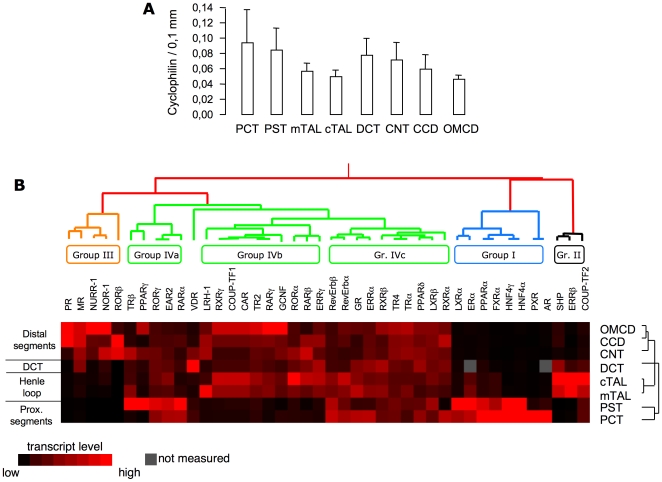
Figure 3. Hierarchical clustering of nuclear receptor expression profile along mouse nephron.
(A) mRNA expression of cyclophilin in the different tubular segments established by QPCR. The mRNA expression profile of NR along the nephron was established by QPCR (n = 5 animals for each segment) and evaluated by unsupervised hierarchical clustering using the Cluster and Treeview software from Standford University [29].

