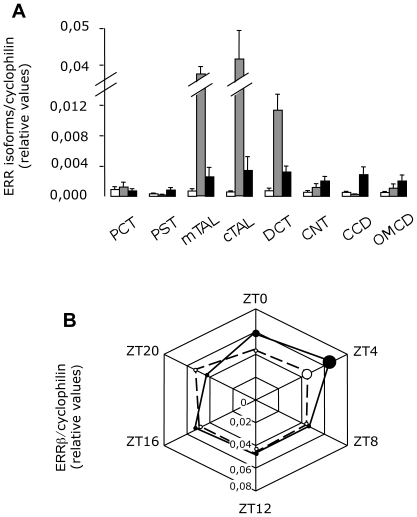
Figure 5. Characterization of ERR family in the kidney.
Quantitative expression of ERRα (white bars), ERRβ (grey bars) and ERRγ (black bars) along the nephron (A). Results are shown as mean ± s.e.m (n = 5). Circadian expression of ERRβ in wild-type (plain line) and in clock-null mice (hatched line). Results are shown as the mean ± s.e.m. (n = 6). The size of the dots is proportional to the s.e.m. values. Test of variance among the different groups was performed (One-way ANOVA) and showed significant variability in wild-type mice (p<0.01) but not in clock-null mice.

