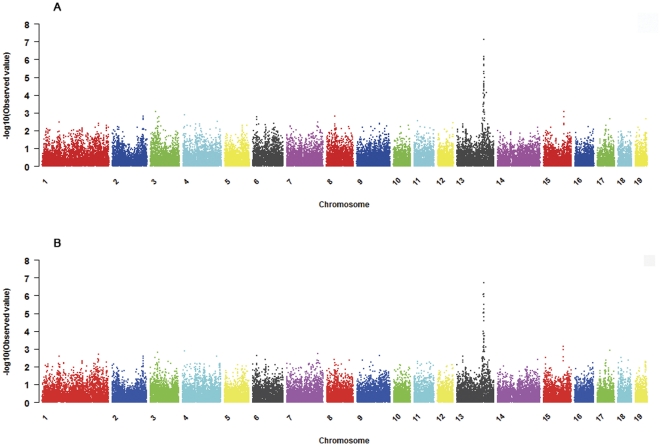
Figure 1. Manhattan plots of genome-wide association for ETEC F4ab/F4ac susceptibility.
Negative log10-transformed p values of all tested SNPs for susceptibility to ETEC F4ab (Fig. 1A) and F4ac (Fig. 1B) are plotted against position on each of 19 chromosomes. Different chromosomes are represented by different colours. Chr. 19 stands for the X chromosome of swine.

