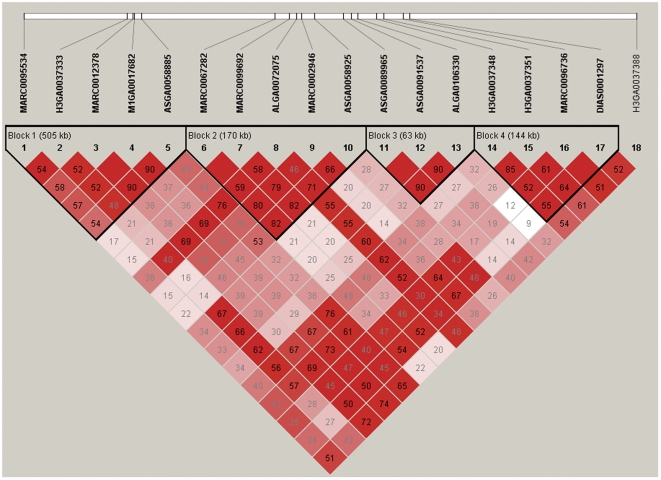
Figure 2. Linkage disequilibrium (LD) pattern for common significant SNPs on SSC13.
LD blocks are marked with triangles. Values in boxes are LD (r2) between SNP pairs and the boxes are coloured according to the standard Haploview colour scheme: LOD>2 and D′ = 1, red; LOD>2 and D′<1, shades of pink/red; LOD<2 and D′ = 1, blue; LOD<2 and D′<1, white (LOD is the log of the likelihood odds ratio, a measure of confidence in the value of D′).

