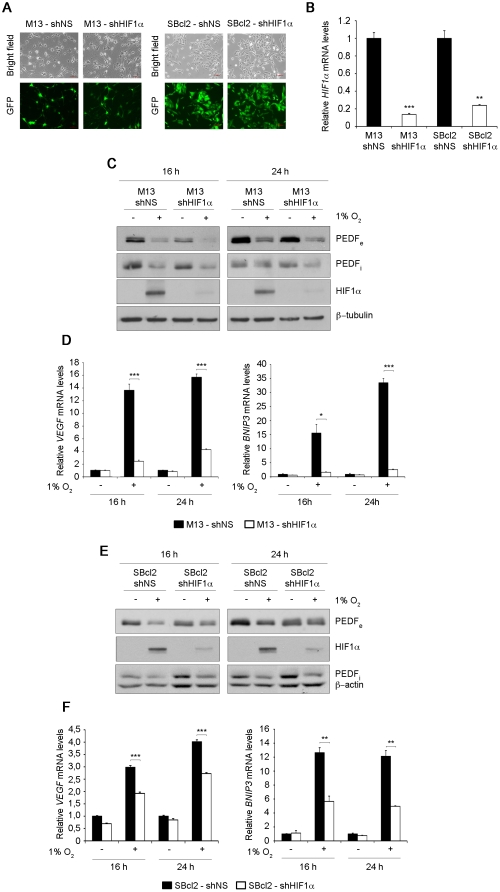
Figure 3. Hypoxia-induced downregulation of PEDF is HIF-independent in melanocytes and SBcl2 melanoma.
(A) Transduction efficiency of M13 primary melanocytes (left panels) and SBcl2 melanoma cell line (right panels) after infection with non-silencing (shNS) or shRNAmir to HIF1α (shHIF1α) lentivirus at multiplicity of infection of 40 (M13) or 60 (SBcl2). Fluorescence images (40× magnification) show more than 90% GFP-positive cells. (B) Quantitative RT-PCR analysis of HIF1α mRNA levels in M13-shNS, M13-shHIF1α primary melanocytes and SBcl2-shNS, SBcl2-shHIF1α melanoma cell lines. HIF1α mRNA levels are shown relative to control shNS cells after normalization to 18s rRNA. Bars represent average ± standard deviation (SD) (**P<0.01; ***P<0.001). (C) Western blot analysis of extracellular PEDF (PEDFe) protein levels in conditioned medium (CM), intracellular PEDF (PEDFi) and HIF1α protein levels in whole-cell extracts from M13-shNS and M13-shHIF1α primary melanocytes incubated under normoxia (21% O2) or hypoxia (1% O2) for 16 h and 24 h. β-tubulin was used as loading control. (D) Quantitative RT-PCR analysis of VEGF (left panel) and BNIP3 (right panel) mRNA levels in M13-shNS (filled bars) and M13-shHIF1α (empty bars) primary melanocytes. VEGF and BNIP3 mRNA levels are shown relative to M13-shNS under normoxia after normalization to 18s rRNA. Bars represent average ± SD (*P<0.05; ***P<0.001). (E) Western blot analysis of PEDFe protein levels in CM, PEDFi and HIF1α protein levels in whole-cell extracts from SBcl2-shNS and SBcl2-shHIF1α melanoma cell lines incubated under normoxia or hypoxia for 16 h and 24 h. β-actin was used as loading control. (F) Quantitative RT-PCR analysis of VEGF (left panel) and BNIP3 (right panel) mRNA levels in SBcl2-shNS (filled bars) and SBcl2-shHIF1α (empty bars) melanoma cell lines. VEGF and BNIP3 mRNA levels are shown relative to SBcl2-shNS under normoxia after normalization to 18s rRNA. Bars represent average ± SD (**P<0.01; ***P<0.001).

