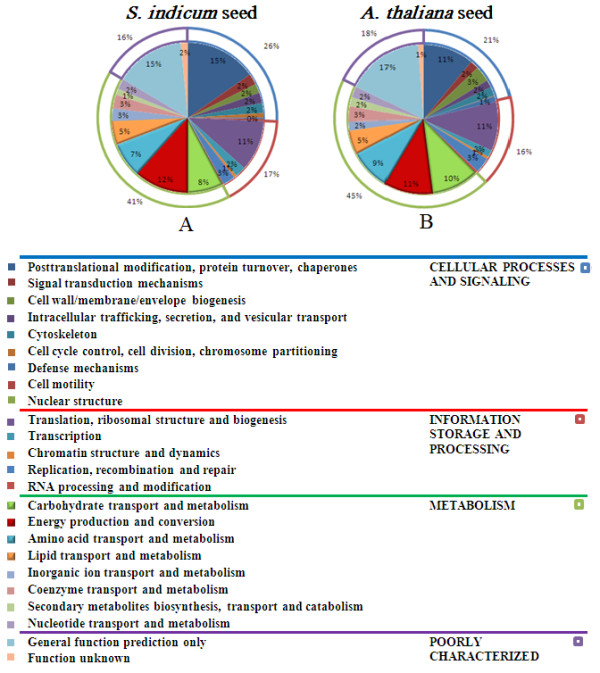
Figure 3.

Comparison of annotation of sesame ESTs (A) with those of Arabidopsis (B). Two cDNA data sets were classified into functional groups by using the COG database; The colors of each functional group are indicated in the table. Graphs are outlined with multi-color frames which represent four subcategories: 'information storage and processing' (red), 'cellular processing and signaling' (blue), 'metabolism' (green) and 'poorly characterized' (purple). A: S. indicum seed COG annotaiton; B: A. thaliana seed COG annotation.
