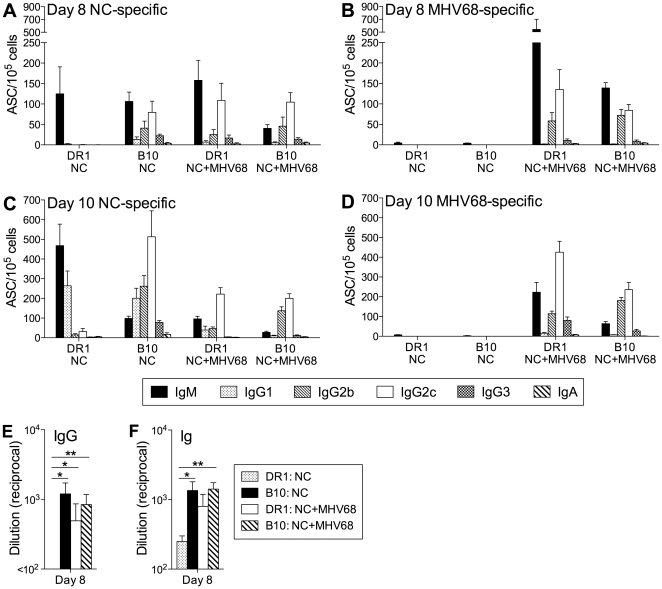
Figure 8. The NC-specific B cell response in DR1 mice is modulated by concurrent infection with MHV68.
(A–D) Virus-specific ASC frequencies. DR1 and B10 mice were infected intranasally with NC only, or with NC and MHV68. ASC frequencies in the MedLN were determined by ELISPOT assay on day 8 (A and B) and day 10 (C and D) after infection. ASCs specific for NC or MHV68 were detected using plates coated with disrupted NC (A and C) and disrupted MHV68 (B and D), respectively. (E, F) NC-specific serum IgG (E) and Ig (F) levels. Titers were determined by ELISA and are shown as the reciprocal of the highest serum dilution scored as positive relative to naïve control serum. The mean+SE is shown for 4–9 individual mice per group. * P<0.05, ** P<0.01.

