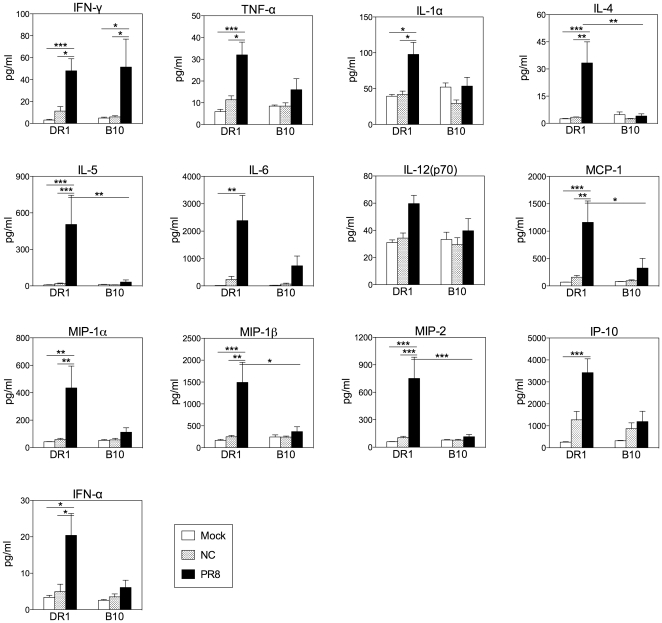
Figure 9. Cytokine and chemokine production in the lung after influenza infection.
DR1 and B10 mice were infected intranasally with NC or PR8 or were mock-infected with PBS. Mice were sampled 60 h after inoculation. Cytokine and chemokine concentrations in clarified lung homogenates were determined by Multiplex assay or by sandwich ELISA (IFN-α only). Figure 9 shows the results for a selection of the 30 cytokine and chemokine determinations. Results for the remaining cytokines and chemokines are shown in figure S4. The mean+SE is shown for 5 individual mice per group. * P<0.05, ** P<0.01, *** P<0.001.

