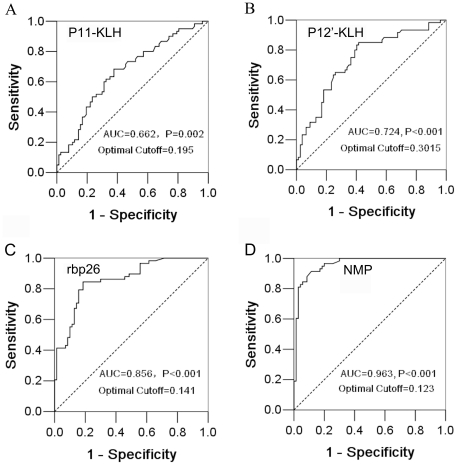
Figure 3. Reactivity of sheep sera to linear epitope peptides, rBP26 and NMP of B. melitensis in ELISAs.
The receiver operating characteristic (ROC) curves were plotted using the SPSS software version 13.0. According to optimal cutoff values by the highest sum of sensitivity and specificity, the areas under ROC curves for antibody responses in sheep sera by ELISAs were compared with the results by a combination of two standard serological tests. P value was calculated for comparing the differences between areas under ROC curve and reference (0.5) by the Kolmogorov-Smirnov Z analysis.

