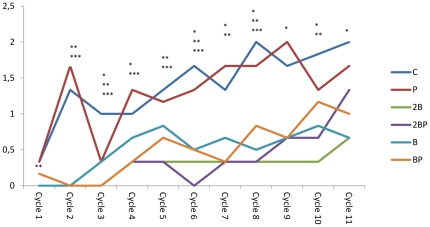
Figure 1. Disease activity index.
Disease activity index (DAI) during the 11 cycles of DSS administration. DAI scores are expressed as medians (25 and 75 percentiles). Significant differences are expressed versus the C group. Cycle 1: **P<0.01 for groups 2B, 2BP and B; Cycle 2: **P<0.01 for groups B and BP, *** P<0.001 for groups 2B and 2BP groups; Cycle 3: *P<0.05 for group P, **P<0.001 for group B group, ***P<0.001 for groups 2B, 2BP and BP; Cycle 4: *P<0.05 for group BP, ***P<0.001 for groups 2B and 2BP; Cycle 5: **P<0.01 for group B group, ***P<0.001 for groups 2B, 2BP, and BP; Cycle 6: *P<0.05 for group B, **P<0.01 for group BP,***P<0.001 for groups 2B and BP; Cycle 7: *P<0.05 for group B, **P<0.01 for groups 2B and B, ***P<0.001 for groups 2BP and BP; Cycle 8: *P<0.05 for group BP, **P<0.01 for groups 2B and B, ***P<0.001 for group 2BP; Cycle 9: *P<0.05 for groups 2B, 2BP, B, BP; Cycle 10, *P<0.05 for group B, **P<0.01 for groups 2B and 2BP; Cycle 11: *P<0.05 for groups 2B, 2BP, B, BP.

