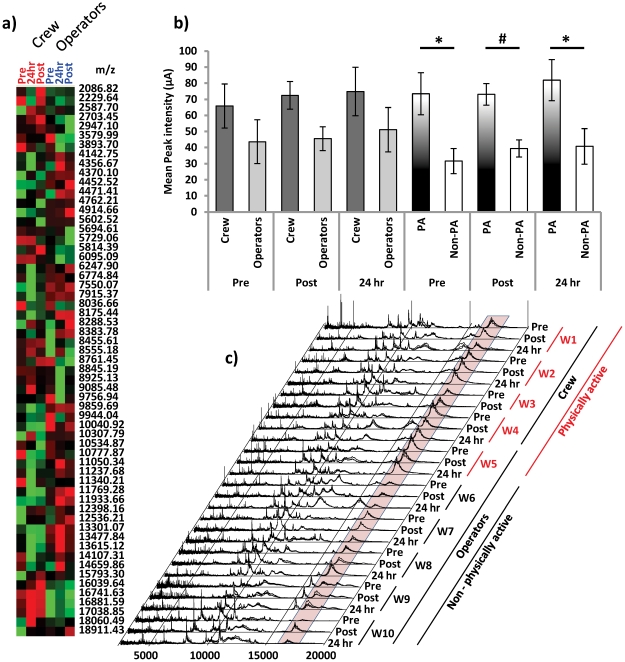
Figure 2. The spectral feature at m/z 16,881 is associated with physically active workers.
a) Cluster analysis of SELDI-TOF MS data from urinary protein of mining workers. The 3 values centred around m/z 16881 constitute a major feature differentiating between crew (Red, Pre, Post & 24 hr) and operators (Blue, Pre, Post & 24 hr). Red squares indicate peak intensities above the average and green squares indicate peak intensities below the average intensity for the specified m/z value. Note block of m/z values centred on m/z 16881. b) Closer examination of the spectral feature m/z 16881 revealed that although the mean peak intensity appeared different between crew and operators at each time point the difference was not significant. Further examination of individual worker spectra indicated that 1 operator (W5) had a relatively high peak intensity at m/z 16881 in all three of his samples and according to information provided in the health and physical activity questionnaires W5 was the only participant to have engaged in a gym workout (resistance training) within the 24 hr period prior to sampling. Thus W5 and the crew were re-classified as the physically active (PA) cohort (n = 5) and the remaining operators were reclassified as the non-physically active (Non-PA) cohort (n = 5). The peak intensity of m/z 16881 was significantly higher in the PA workers compared to the Non-PA workers. Data is the mean peak intensity +/− SEM. Significance is given as * p<0.05 or # p<0.01 (Mann Whiney - U Test) c) The spectral feature centred around m/z 16881 (shaded box) generally displays a higher intensity in the physically active workers compared to workers who were less physically active. Spectral profiles for each worker are stacked replicates (n = 3 per profile).

