Fig. 5.
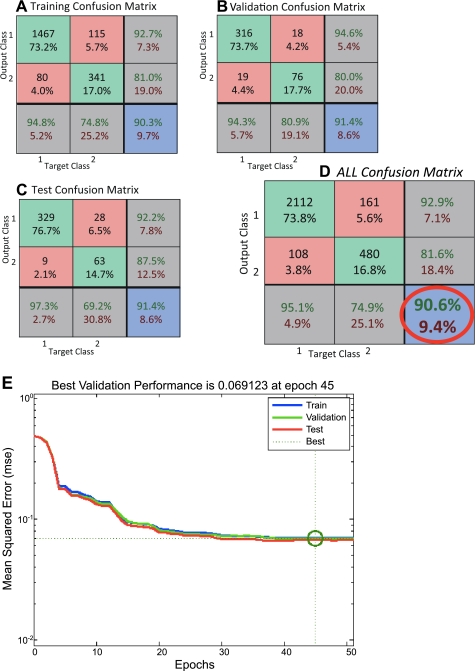
A–D: confusion matrices and performance plots obtained for the NN vs. the human coders. Overall performance and validation of the network can be identified within the red circle. NN was able to identify 90.6% of the events of immobility in agreement with the human coders. In each one of the confusion matrices, the top left green square corresponds to true positive (TP) incidents in absolute numbers and the percentage of TP incidents in total incidents used. Central green square corresponds to true negative (TN) incidents in absolute numbers and the percentage of TN incidents in total incidents used. Top red square corresponds to false positive (FP) incidents in absolute numbers and the percentage of FP incidents in total incidents used (describing statistical type 1 error). Middle left red square corresponds to false negative (FN) incidents in absolute numbers and the percentage of FN incidents in total incidents used (describing statistical type 2 error). Top right gray square with green letters describes the positive predictive value [TP/(TP+FP)]×100 and with the red letters the [FP/(TP+FP)]×100. Middle right gray square with green letters describes the negative predictive value [TN/(TN+FN)]×100 and with the red letters the [FN/(TN+FN)]×100. Bottom left gray square with green letters describes the sensitivity [TP/(TP+FN)]×100 and with the red letters the [FN/(TP+FN)]×100. Bottom middle gray square with green letters describes the specificity [TN/(TN+FP)]×100 and with the red letters the [FN/(TN+FP)]×100. Finally, the bottom right blue square with green letters describes the correctly classified incidents [(TP+TN)/total incidents used]×100, and with the red letters the incorrectly classified incidents [(FP+FN)/total incidents used]×100. Glossary of terms used: incidents were the signal data used as an input for the NN (immobility or mobility signals); total incidents were the total number of signals used for the construction of each confusion matrix; target class refers to the known immobility signals (target class 1) and the known mobility signals (target class 2) that the NN was supplied with; output class refers to the NN's classification response to the input data denoting as output class 1 the classification of immobile and as output class 2 the classification of mobile; TP were the incidents that were immobile and were classified as immobile; TN were the incidents that were mobile and were classified as mobile; FP were the incidents that were mobile and were classified as immobile; FN were the incidents that were immobile and were classified as mobile. E: performance plot of the NN. y-Axis demonstrates the mean squared error where the lower the error the better the performance. x-Axis demonstrates the epochs, which represent a step at the training of the NN. The best results were achieved at epoch 45 in our NN.

