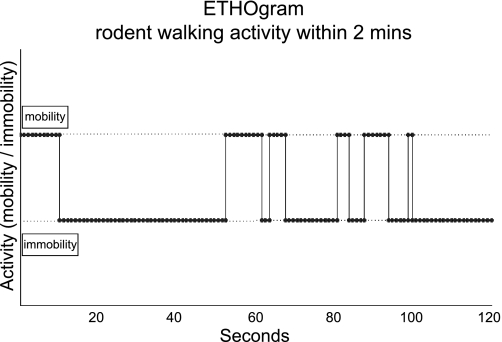
Fig. 6.
Example of an ethogram. Plot of an observed behavior where mobility and immobility events are tracked for a two min period. ARES can create such plots by using the NN structure to automatically label the mice behavior in a video track. Top line level is used for events (dots) of mobility whereas the bottom line level is used to plot events of immobility.

