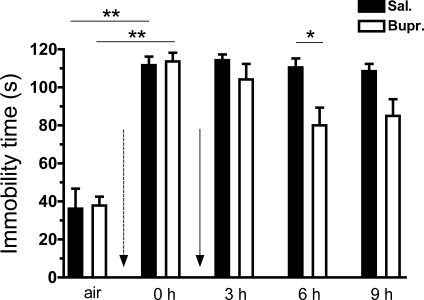
Fig. 7.
Immobility times calculated by the NN within a 2-min period before and following exposure to Cl2 and treatment with either buprenorphine or saline. We used the NN developed for the ARES software to identify immobility times in different groups. Following return to room after exposure to Cl2 (400 ppm for 30 min; dotted arrow), mice were injected intraperitoneally with either buprenorphine (0.05 mg/kg) or saline (solid arrow). y-Axis shows the immobility times in s [means ± SE (n = 6 mice per group)] for a 2-min period. Comparisons were done pre-exposure (air) vs. mice immediately postexposure to Cl2 (0 h, within 15 min). Dotted arrow signifies return to room after Cl2 exposure before the treatments with saline or buprenorphine. Solid arrow signifies the administration of treatments. Black bars refer to the saline injected mice and white bars to the buprenorphine-injected mice. **P < 0.01 (Mann-Whitney test, Kolmogorov-Smirnov test for normality). *P < 0.05 (2-way repeated-measures ANOVA to compare means for 3, 6, and 9 h postexposure followed by post hoc analysis with the t-test).

