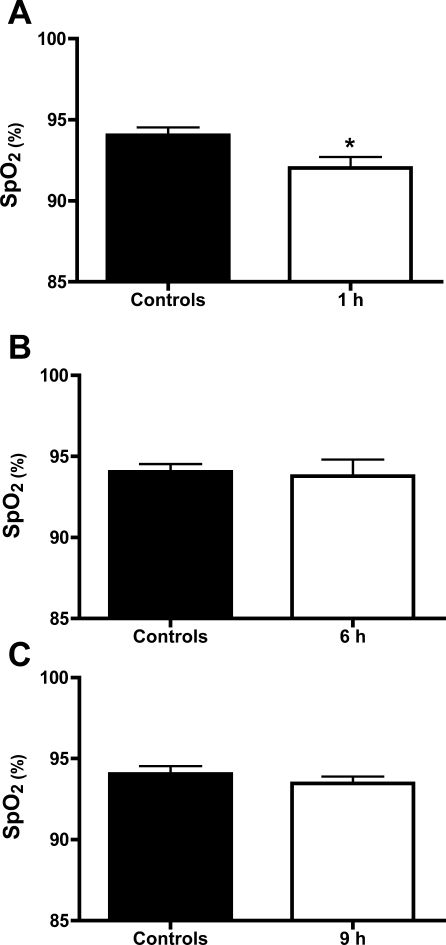
Fig. 8.
Peripheral oxygen saturations post Cl2 exposure. Mice were exposed either in Cl2 (400 ppm for 30 min; white bars) or air (solid bars). Oxygen saturations were measured noninvasively as mentioned in materials and methods at various times post Cl2 exposure. Values are means ± SE (n = 6 for each group). Comparisons were made based on Kolmogorov-Smirnov normality test results using either one-sided unpaired t-test (A and C) or one-sided Mann-Whitney exact test (B). *P = 0.0241.

