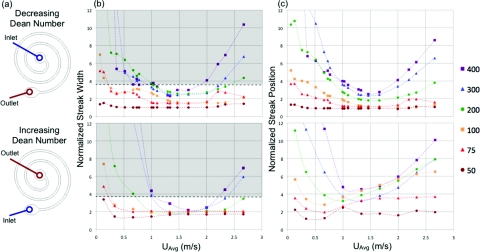
Figure 4.
Device schematics (a) with arrows indicating the difference between the increasing and decreasing Dean number cases (inlet and outlet reversed). Quantitative comparison of normalized streak width (b) and normalized streak position (c) or the distance from the inside wall normalized by the particle diameter for cases of both decreasing (top) and increasing (bottom) Dean number along the device. The gray area indicates that the streak width is greater than 3.8 particle diameters at the 5% threshold.

