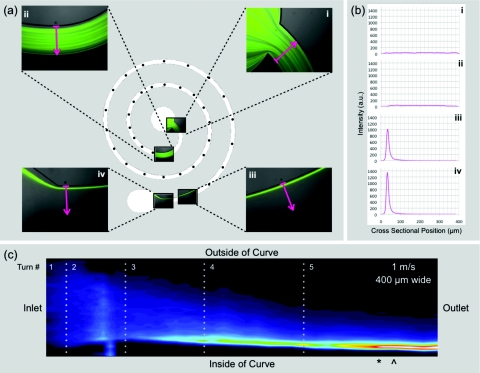
Figure 6.
(a) A device schematic with imaging positions marked by dots along the channel with the first and last two positions highlighted with the actual images and the cross-sectional lines used to generate (b) the intensity profiles which are then stacked, smoothed, and converted to (c) image form effectively a straightened image of the focusing behavior in the spiral device which is labeled with points of importance separating the different behavior regimes (*: focusing achieved; ^: point of closest wall approach). There is no breakdown in this example image. The dotted lines demarcate where the channel curvature changes or, in other words, the interface between turns.

