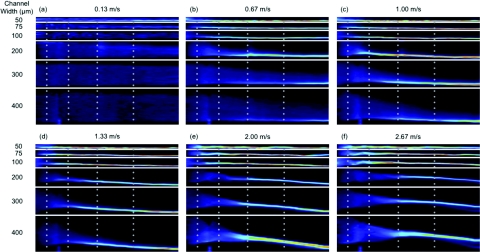
Figure 7.
Straightened images for similar flow conditions to those presented in Figure 2 for all channel widths. Dark blue is low intensity and red/white is high intensity seen when a focused streak is formed. All images are for decreasing Dean number devices.

