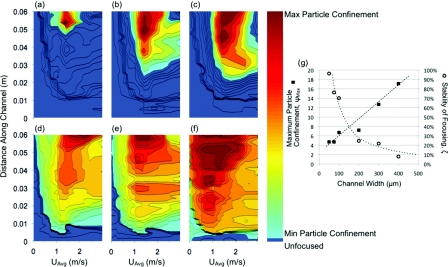
Figure 8.
State diagrams for each decreasing Dean number device whose shading indicates the particle confinement (dark gray (red online) maximum – light gray (cyan online) minimum – medium gray areas next to light gray (dark blue online) unfocused) over the length of the device in the vertical direction and the different average downstream velocities in the horizontal direction for the different width channels (a) 400 μm, (b) 300 μm, (c) 200 μm, (d) 100 μm, (e) 75 μm, and (f) 50 μm. A plot (g) of the actual maximum particle confinement for each device and the corresponding amount of the parameter space where focusing was achieved. Guidelines for the maximum particle confinement (dashed) and focusing stability (dotted) are given as well.

