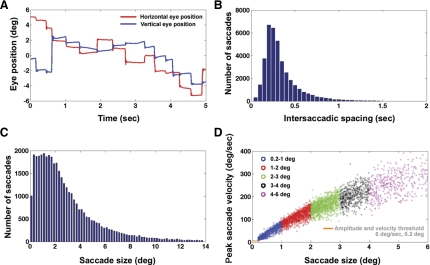
Fig. 1.
A: example plot of eye position vs. time in the visual-search task. Note the short periods of fixation and the closely spaced saccades of multiple sizes. B: pooled histogram across subjects of intersaccadic spacings observed during visual search. C: pooled histogram across subjects of saccade amplitudes during visual search. D: saccadic main sequence for a subject performing a visual search. The amplitude range is split up into 5 different regressors: 0.2–1.0-degree saccades, 1–2-degree, 2–3-degree, 3–4-degree, and 4–6-degree saccades. The minimum velocity and amplitude thresholds for a detected change in eye position to be classified as a saccade are indicated by the orange lines.

