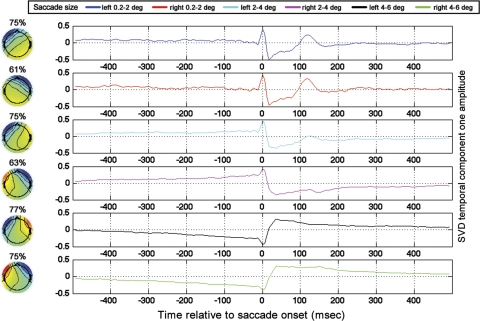
Fig. 11.
SVDs of cross-subject averages of lateralized GLM results. The percentage over each topography indicates the percent variance accounted for by SVD component 1 in the ±35-ms window around saccade onset. Time functions for all saccade sizes are plotted in the rightmost panels according to the legend shown. Time is relative to saccade onset.

