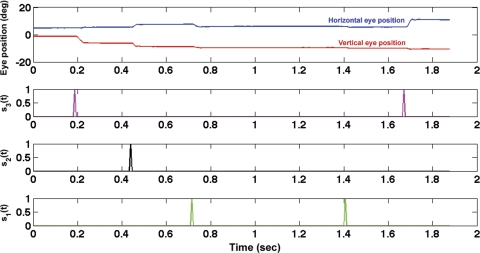
Fig. 2.
Example plot of regressors and eye position vs. time for a segment of visual-search data. Horizontal eye position is plotted in blue, and vertical eye position is plotted in red (top). Each regressor (sr) plotted in a different color (top-middle, bottom-middle, bottom), corresponds to saccades detected in a different amplitude range. Each sr consists of unit pulses at times of saccade onset.

