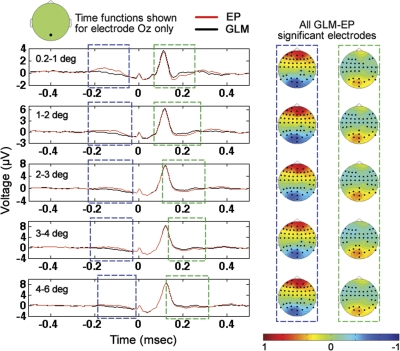
Fig. 5.
Comparison of the cross-subject average of GLM and EP results for all 5 saccade sizes. Note that, for all saccade sizes, the EP results were significantly different (P < 0.05) from the GLM results as a result of the superposition of temporally adjacent saccades. Topographies shown are GLM minus EP differences from the 2 time periods of significant difference shown, with electrodes included in the significant clusters highlighted in bold. In addition to the significant clusters in the 2 highlighted time windows shown that included electrode Oz, there were also significant differences in the −50 to 100-ms window for all saccade sizes at electrodes on the scalp not including electrode Oz.

