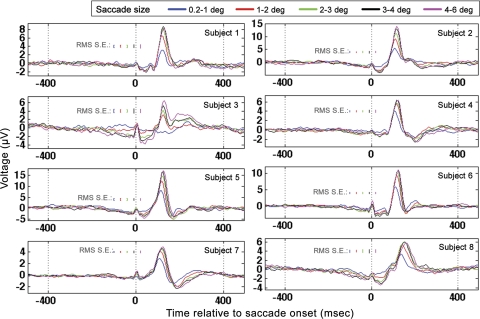
Fig. 8.
Occipital electrode (Oz) GLM results for all subjects when time locked to saccade onset. Results for all saccade sizes are plotted according to the legend at top. Root mean square (RMS) standard errors were determined from repeated applications of the GLM to distinct, nonoverlapping temporal segments of data as described in the text.

