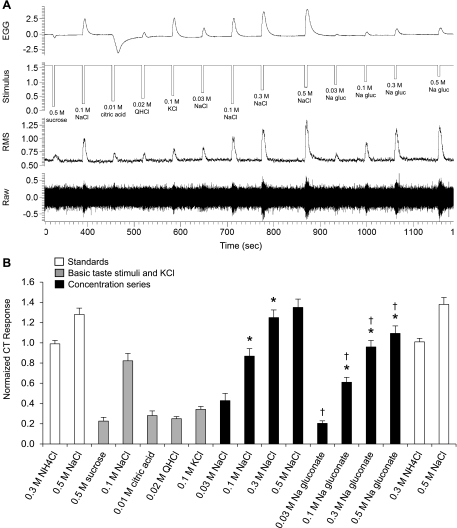
Fig. 1.
Raw electrophysiological traces from the chorda tympani (CT) nerve (A) and average responses (B; n = 6) to 0.3 M NH4Cl, 0.5 M sucrose, 0.03–0.5 M NaCl, 0.01 M citric acid, 0.02 M quinine hydrochloride (QHCl), 0.1 M KCl, and 0.03–0.5 M Na-gluconate. Data are normalized to the average NH4Cl response. Comparative stimuli (0.3 M NH4Cl and 0.5 M NaCl) are shown in white, standard taste stimuli are shown in gray, and sodium salt concentration response functions are shown in black. *Significantly different from the proceeding concentration; †significantly different from NaCl at an equimolar concentration. EGG, electrogustogram; RMS, root mean square.

