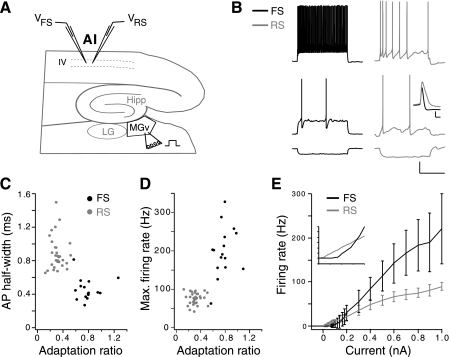
Fig. 1.
Experimental design and comparison of firing properties of fast-spiking (FS) and regular-spiking (RS) cells. A: schematic illustrating auditory thalamocortical brain slice. Simultaneous recordings were performed in layers 3–4 of primary auditory cortex (AI) in one FS cell with 1–3 RS cells. The ventral division of the medial geniculate nucleus (MGv) was stimulated extracellularly at various intensities with a bipolar stimulating electrode. Hippocampus (Hipp) and lateral geniculate nucleus (LG) are also depicted. B: example RS and FS cell responses to 1-s current step injections at −0.05 nA (bottom), threshold current injection for each cell (middle; 0.12 nA for FS cell, 0.04 nA for RS cell), and ∼2.5× threshold current (top). Scale bars are 20 mV, 500 ms. Inset: the 1st action potentials (APs) in B, middle, aligned to voltage threshold to illustrate the characteristic AP shapes of FS and RS cells. Inset scale bars are 20 mV, 1 ms. C: AP half-width vs. adaptation ratio. D: maximum firing rate vs. adaptation ratio. E: average firing rate vs. current curves for FS and RS cell population. Inset: magnification of curves near threshold. Error bars omitted for clarity. Inset division markings are 5 Hz, 0.05 nA. C–E: RS cells, n = 31; FS cells, n = 16.

