Fig. 3.
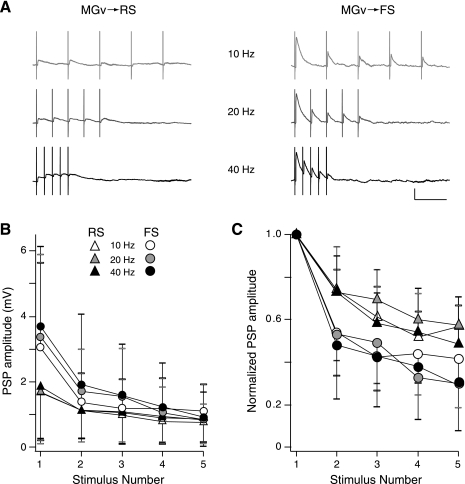
Comparison of thalamocortical (TC) synaptic depression in FS and RS cells. A: example FS-RS cell pair illustrating synaptic depression. Trains of 5 near-threshold intensity stimuli were delivered to MGv at 10, 20, and 40 Hz. Scale bar: 2 mV, 100 ms. B: average PSP amplitudes elicited by repetitive stimulation of MGv. TC PSPs recorded in FS cells are initially larger than RS cells but depress to similar amplitudes, indicating that FS cells show greater synaptic depression. C: average of normalized PSP amplitudes elicited by repetitive stimulation of MGv. Individual cell responses were normalized to the 1st PSP response in a train and then averaged across cells. FS cells exhibited greater synaptic depression at all stimulus frequencies. B and C: 10 Hz: FS cells, n = 14; RS cells, n = 19; 20 Hz: FS, n = 12; RS, n = 16; 40 Hz: FS, n = 10; RS, n = 14. Key refers to both B and C.

