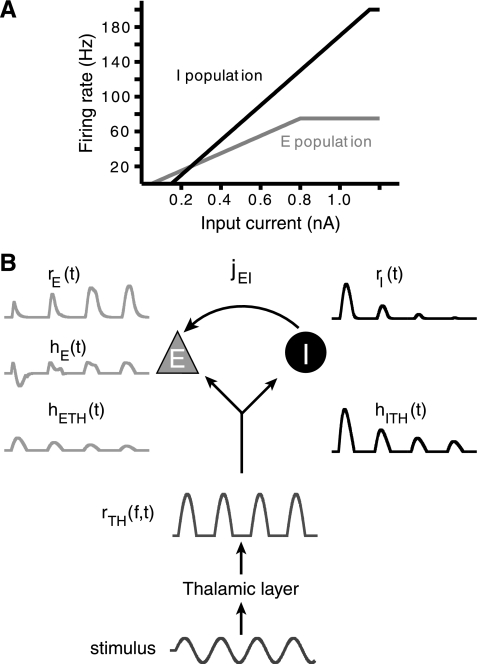
Fig. 4.
Model design. A: transfer functions, ΦE and ΦI, for E (gray) and I (black) populations. ΦE and ΦI are threshold-linear functions. Note the narrow range of current intensities for which the E population firing rate lies above the I population. B: schematic depiction of 2-population feedforward network. Examples are shown next to specific processing stages for a given stimulus. A modeled stimulus (bottom) is delivered to the thalamic populations. This input is transformed by ΦTH into thalamic firing rate rTH(Δf,t). Thalamic activity is summed and then converted by synaptic strength (jETH, jITH in pA/Hz) and scaled by synaptic depression into thalamic currents hETH(t) and hITH(t) (in pA). The I population response, rI(t), is converted by jEI (arrow) into the inhibitory current onto the E population, hEI (not shown). hETH(t) and hEI(t) sum linearly to hE(t) to generate the E population rate response rE(t) (top left).

