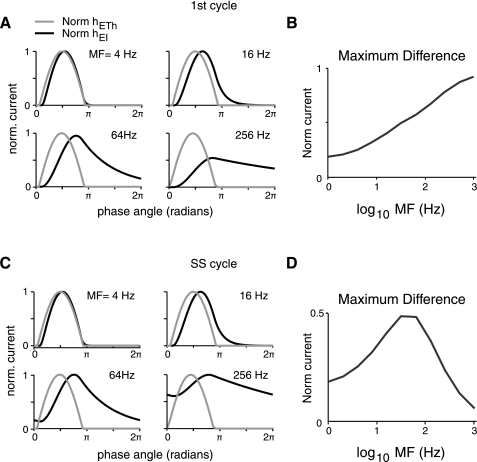
Fig. 7.
Tuning of synaptic currents differs for onset vs. steady-state response. hETH(t) and hEI(t) were normalized to their maximums for a given stimulus MF. Normalized hEI(t) is positive, although all nonnormalized values are negative. A: normalized synaptic currents elicited for the 1st cycle of modulated stimuli plotted vs. phase angle. As MF increases, there is an increasing delay in hEI(t) relative to hETH(t). B: maximum of the difference of the normalized 1st cycle currents plotted vs. MF. Inhibition makes the network high pass for peak current. C: normalized synaptic currents for 1 cycle at steady-state (SS) response of modulated stimuli vs. phase angle. Measurements are taken from the cycle starting 500 ms after stimulus onset. At higher MFs, hEI(t) summates temporally and remains elevated during the duration of the cycle. D: maximum of the difference of the normalized steady-state currents vs. MF. Temporal summation of hEI(t) and inhibition makes the network band pass with respect to peak current for repetitive stimuli.

