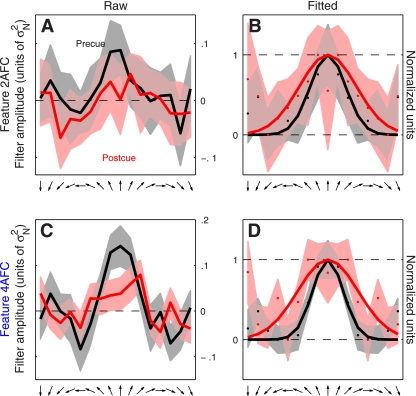
Fig. 3.
Directional tuning functions for feature-based attention. Raw data are plotted in the left column for both 2AFC (A) and 4AFC (C) versions of the experiment. Same data are plotted in the right column but after symmetrically averaging the traces around the center and rescaling them to range between 0 and 1. Solid curves in B and D show best-fit raised Gaussian functions (see methods). Shading shows ± 1 SE. The tuning curve has been arbitrarily centered on the upward direction but it refers to all directions reported by the observer (see methods). Filter amplitude in A and C is in units of noise variance σN2.

