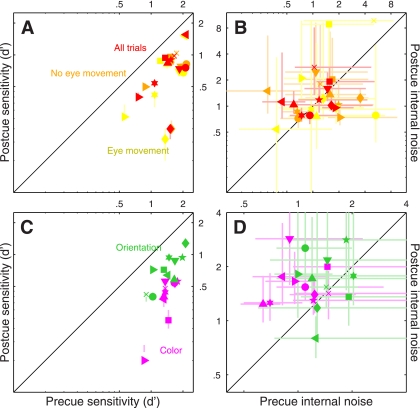
Fig. 6.
Performance metrics for spatial, color-based, and orientation-based attention. Sensitivity is plotted at left; internal noise is at right. Plotting conventions are similar to those used in Fig. 2. A and B: data for spatial attention: red from all trials, yellow and orange symbols from trials on which observers did or did not move their eyes respectively (see methods for a specification of how this distinction was drawn). C–D: data for the color-based attention experiment (magenta) and the orientation-based experiment (green).

