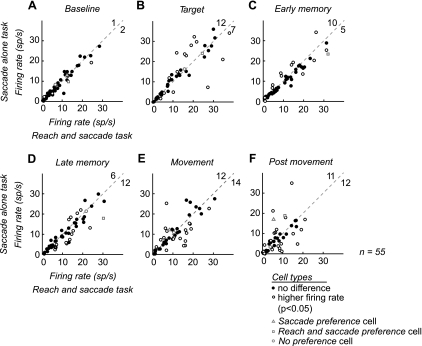
Fig. 3.
Scatterplots of cell firing rate during different trial epochs. A–F: average firing rate for each cell during each 500-ms epoch plotted for the saccade-alone task (y-axis) and the reach and saccade task (x-axis) in the preferred direction. Open circles, cells with a significant difference between the 2 tasks. Filled circles, cells without a significant difference between the 2 tasks. Significance was determined with a random permutation test. Three example cells from Fig. 2: saccade preference cell (open gray circle), reach and saccade preference cell (open gray triangle), and no preference cell (open gray square). For visibility, axes are plotted to 50 spikes/s. Therefore, cells with firing rates higher than 50 spikes/s are not shown. The total number of cells showing a significant difference for each task is shown in the top right corner of each plot. This number includes cells not visible on the axes.

