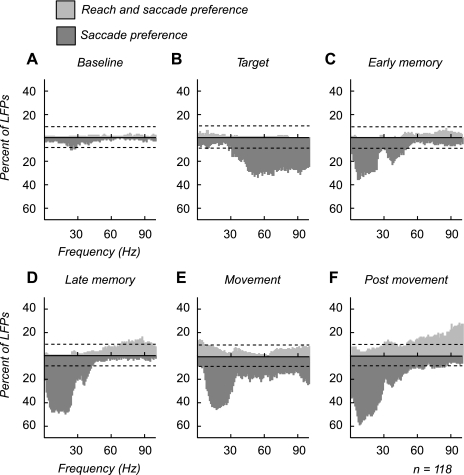
Fig. 5.
Percentage of local field potentials (LFPs) showing a significant difference in power at each epoch. A–F: histograms indicating % of LFPs that show a significant change in power between the 2 tasks at each frequency during each epoch. Dark gray, LFPs with significantly higher power for the saccade-alone task. Light gray, LFPs with significantly higher power for the reach and saccade task. The dashed line indicates % of LFPs that one would expect to be significant by chance. Therefore, frequencies exceeding the dashed line had a significantly higher percentage of LFPs than chance (P < 0.05, binomial distribution). Significance was determined with a random permutation test (P < 0.05).

