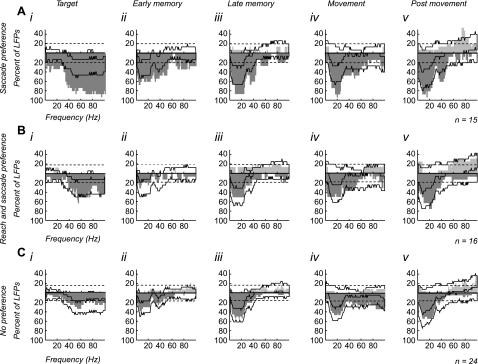
Fig. 6.
LFPs recorded simultaneously with cells classified as saccade preference, reach and saccade preference, and no preference: LFPs recorded on the same electrode as saccade preference cells (A), reach and saccade preference cells (B), and no preference cells (C) that showed a significant difference in power between the 2 tasks during each epoch (i–v). Images were generated with the same protocol as Fig. 5. Significance was determined with a random permutation test (P < 0.05). The dark gray histograms indicate LFPs that had significantly higher power for the saccade-alone task. The light gray histograms indicate LFPs that had significantly higher power for the reach and saccade task. The dashed line indicates % of LFPs that one would expect to be significant by chance (P < 0.05, binomial distribution). The solid black line indicates the range of frequencies that are expected to be significant based on the population responses observed in Fig. 5. Frequencies that exceed solid black line are significantly higher percentages than would be expected by chance (P < 0.05, binomial distribution).

