Abstract
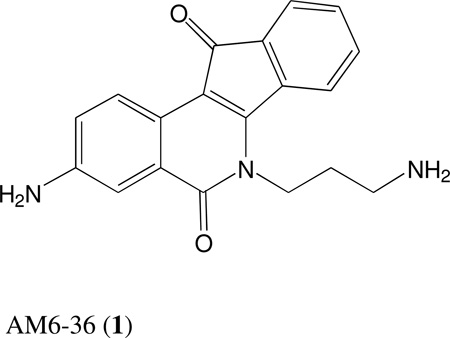
Recently, we reported that 3-amino-6-(3-aminopropyl)-5,6-dihydro-5,11-dioxo-11H-indeno[1,2-C]isoquinoline (AM6-36), sharing structural similarity with naturally occurring isoquinolines, induced activities mediated by retinoid X receptor (RXR) response element accompanied by anti-proliferative effects with breast cancer cells. To further characterize the biologic potential of AM6-36, we currently report studies conducted with HL-60 human leukemia cells. AM6-36 significantly inhibited the cellular proliferation in a dose- and time-dependent manner with an IC50 value of 86 nM. When evaluated at low test concentrations (≤0.25 µM), AM6-36 induced arrest in the G2/M phase of the cell cycle. At higher concentrations (1 and 2 µM), the response shifted to apoptosis, which was consistent with the effect of AM6-36 on other apoptotic signatures including an increase of apoptotic annexin V+ 7-AAD− cells, loss of mitochondrial membrane potential, induction of poly (ADP-ribose) polymerase (PARP) cleavage, and activation of several caspases. These apoptotic effects are potentially due to up-regulation of p38 MAPK and JNK phosphorylation, and down-regulation in c-Myc oncogene expression. Taken together, AM6-36 might serve as an effective anti-cancer agent by inducing G2/M cell cycle arrest and apoptosis through the activation of MAPKs and inhibition of c-Myc.
Isoquinolines are prevalent in nature and capable of mediating a variety of biological responses.1 For example, this class of compounds includes anesthetics, antihypertension agents, disinfectants, and vasodilators. Effects are also mediated that are relevant for the prevention or treatment of cancer. Berberine,2,3 sanguinarine,4 dicentrine,5 and tetrandrine6 induce cell cycle arrest or programmed cell death (apoptosis) via modulation of cancer-related biomarkers such as COX-2, PGE2 receptor, p38 mitogen-activated protein kinase (p38 MAPK), stress-activated protein kinase/c-Jun N-terminal kinase (SAPK/JNK), and EGFR. Nitidine, sharing the isoquinoline backbone structure with indenoisoquinolines, has been reported to inhibit topoisomerase 1 (top1).7 Indenoisoquinolines such as the camptothecins are well known inhibitors of topoisomerase I,8 but various other activities are known, such as induction of cell cycle arrest, overcoming multidrug-resistance, and enhancing the differentiation-inducing activity of retinoids.9–11
Our research group has invested major effort and resources in the structure-based design and synthesis of indenoisoquinoline topoisomerase I inhibitors, two of which (LMP400 and LMP776) are in phase 1 clinical trials at the NCI.12 During these studies, several indenoisoquinolines were subjected to an ongoing screen designed to discover retinoid X receptor (RXR) agonists. Of a total of 5000 substances tested, only one, our indenoisoquinoline 3-amino-6-(3-aminopropyl)-5,6-dihydro-5,11-dioxo-11H-indeno[1,2-C]isoquinoline dihydrochloride (AM6-36; 1), was found to induce the transactivation of the RXR response element (RXRE) in a cell-line based dual luciferase assay system.13 RXRE is one of the cis-acting hormone response elements in the promoter region of target genes, which consists of two repeated consensus hexamers (AGGTCA) separated by one nucleotide, and can be transactivated by RXRs.14 Both naturally occurring and chemically synthesized rexinoids, including 9-cis-retinoic acid, AGN194204, CD3254, LG100268, LGD1069 (bexarotene), and SR11237 have shown promise in the prevention and treatment of cancer by inducing differentiation and apoptosis.15 Notably, bexarotene is used for the treatment of cutaneous T cell lymphoma, and promise has been demonstrated for the treatment of acute myeloid leukemia.16
Leukemia is reported to be the most common mortal cancer in males under the age of 40, and acute lymphocytic leukemia is the most common cancer in children.17 Therefore, after discovering the inductive transcriptional activity of AM6-36 on RXRE, we further investigated the activity of AM6-36 with a leukemia cell line, HL-60. We now report AM6-36 showed G2/M cell cycle arrest and apoptosis in HL-60 cells, accompanied by cleavage of poly (ADP-ribose) polymerase (PARP), cleavage and activation of caspases-3/7 and -9, and down-regulation of c-Myc. Upstream signaling molecules were also investigated, and up-regulation in the phosphorylation of p38 MAPK and SAPK/JNK were observed.
RESULTS AND DISCUSSION
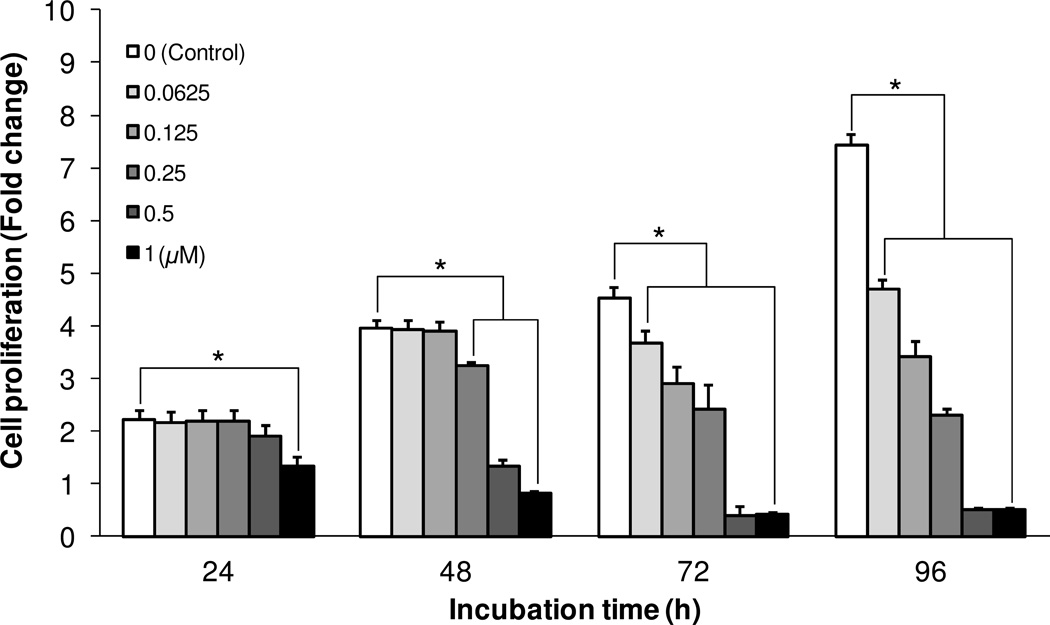
The effect of AM6-36 on the proliferation of HL-60 human acute leukemia cells was evaluated by the measurement of MTT reduction activity. As shown in Figure 1, MTT reduction activity of vehicle (DMSO 0.1%)-treated control cells increased up to 7.42 ± 0.28-fold after 96 h of incubation in comparison with the initial MTT reduction activity at the starting point of compound treatment (0 h, fold change: 1). However, treatment of HL-60 cells with AM6-36 in the concentration range of 0.0625-1 µM decreased MTT reduction activity in a time-and dose-dependent manner in comparison with vehicle-treated control cells, with the half maximal inhibitory concentration (IC50) values of 0.80, 0.35, 0.15, and 0.086 µM at 24, 48, 72 and 96 h of the incubation, respectively. Notably, at concentrations of 0.5 or 1.0 µM, cell density was lower than the starting density. These data suggest AM6-36 might suppress cell proliferation (cytostatic) of HL-60 cells at lower concentrations (≤0.25 µM), and induce cell death (cytotoxic) as the concentration increases.
Figure 1.
Effect of AM6-36 on the proliferation of HL-60 cells. Human acute leukemia cells (HL-60) were seeded at a density of 2×10⁴ cells per well in 96-well cell culture plates. After 24 h of incubation, cells were treated with AM6-36 in the concentration range from 0.0625-1 µM and the incubation was continued for 24, 48, 72, and 96 h. Each bar presents a fold-change (mean ± SD) of OD at 540 nm in each group divided by the OD at 540 nm of the time zero control group (n = 6 per group). *P value less than 0.05 is considered statistically significant from control group (white bars) at each incubation time.
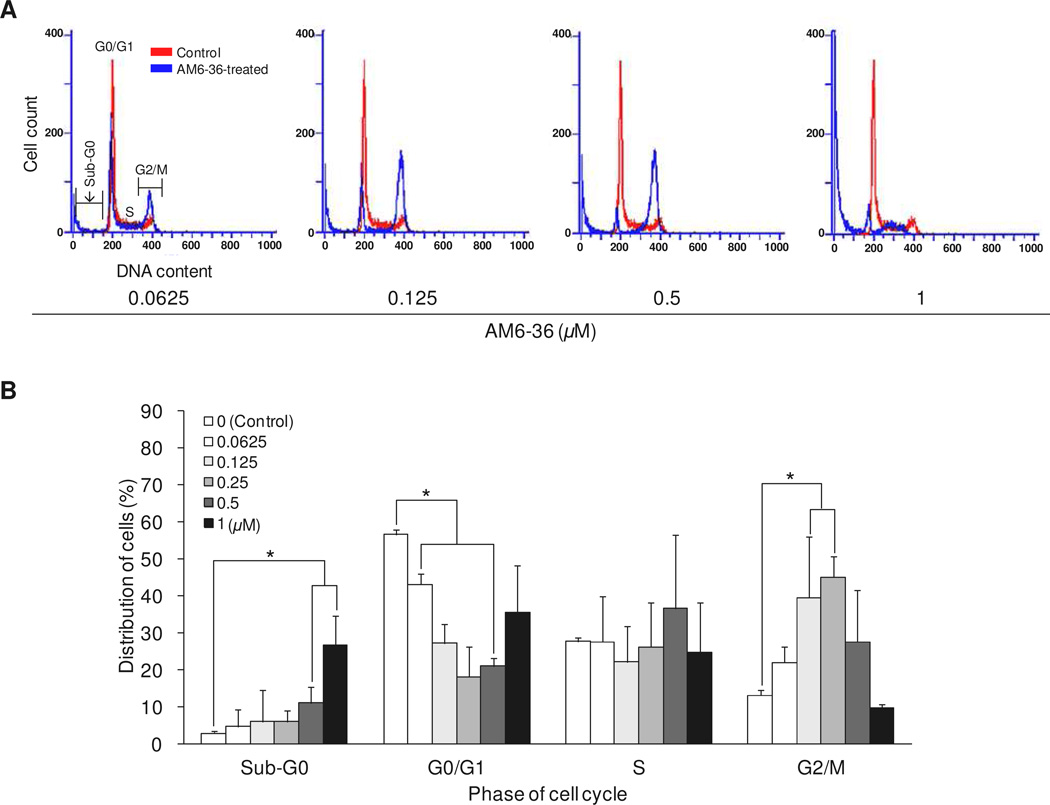
The deregulation of cell cycle machinery due to genetic alteration of cell cycle-related proteins [e.g., cyclin-dependent kinases (CDKs), cyclins, CDK inhibitors, and topoisomerases], proto-oncogenes (e.g., c-Myc), and tumor suppressor genes (e.g., p53) causes persistent and aberrant cell proliferation which is one of the hallmarks of cancer.18,19 Accordingly, regulation of the cell cycle is one approach for cancer therapy. Naturally occurring substances such as camptothecin20 and paclitaxel21 halt cell cycle by acting on topoisomerase I and the mitotic spindle, respectively, and these compounds and derivatives are used in the clinic to treat various types of cancers. We performed further studies with AM6-36 to determine effects on the cell cycle distribution by measuring DNA content (ploidy) using flow cytometry. As shown in Figure 2, treatment with AM6-36 concentrations below 0.5 µM led to cell accumulation in the G2/M phase (0.0625 µM, 22.0 ± 8.0%; 0.125 µM, 39.6 ± 12.2%; 0.25 µM, 45.0 ± 5.7%; 0.5 µM, 27.6 ± 13.8), up to a 31.8% increase compared to the distribution of control cells (13.2 ± 2.8%). In addition, AM6-36 induced a gradual accumulation of cells in the sub-G1 phase as the concentration increased (0.0625 µM, 4.6 ± 1.3; 0.125 µM, 6.0 ± 1.1; 0.25 µM, 6.1 ± 1.3; 0.5 µM, 11.1 ± 4.4; 1 µM 26.5 ± 8.1%) in comparison with control cells (2.8 ± 0.8%). Therefore, with HL-60 cells, AM6-36 exerted anti-proliferative activity with G2/M cell cycle arrest at lower concentrations (≤0.25 µM) and sub-G1 arrest (i.e., apoptosis or necrosis) at higher concentrations.
Figure 2.
Effect of AM6-36 on the cell cycle distribution of HL-60 cells. Cells were treated with various concentrations of AM6-36 for 24 h and stained with NIM-DAPI. The cell cycle distribution of each group was evaluated by DNA content using flow cytometry. Representative histograms of DNA content are shown in (A) and % population in each phase of cell cycle is demonstrated as mean ± SD from three independent experiments (B). *P value less than 0.05 is considered statistically significant from control group (white bars) at each phase.
The increased sub-G1 peak (Figure 2) may imply total cell death, including apoptosis and necrosis. To determine if the sub-G1 peak was due to apoptosis and to measure the apoptotic status of cells exposed to AM6-36, a quantitative assessment of cell death was performed. One method to detect cellular apoptosis is annexin V/7-AAD double staining which exploits one aspect of apoptosis, the translocation of phosphatidyl serine (PS) from the inner to outer leaflet of the plasma membrane and consequent loss of phospholipid asymmetry.22,23 FITC-conjugated annexin V binds to PS specifically located in the outer leaflet of plasma membrane with high affinity, while 7-AAD stains the nucleus when cellular plasma membrane integrity is disrupted. Cells stained with annexin V-FITC without or with 7-AAD staining were considered as early or late apoptotic cells, respectively.
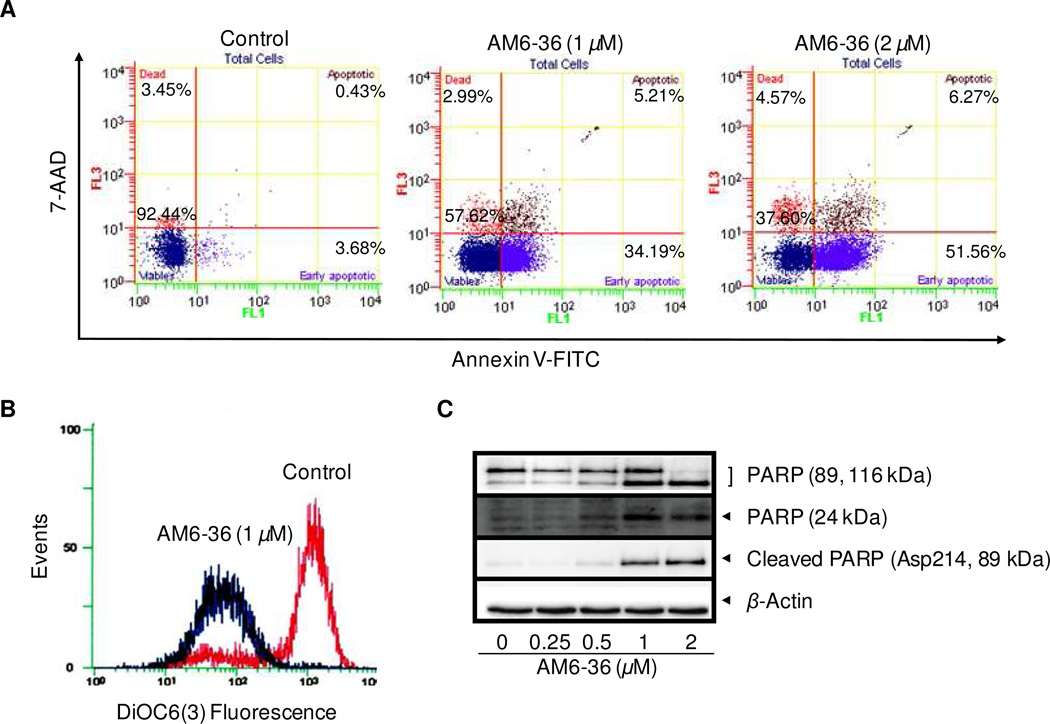
Since AM6-36 induced the highest sub-G1 peak when treated at the concentration of 1 µM (Figure 2), HL-60 cells were exposed to AM6-36 at 1 µM and a two-fold higher concentration, 2 µM. The cell population (Figure 3A) of control group was localized in the lower left area (92.44% of total population) which presents viable cells without staining by either annexin V or 7-AAD. However, treatment with AM6-36 for 24 h induced early (1 µM, 34.19%; 2 µM, 51.56%) and partially late apoptosis (1 µM, 5.21%; 2 µM, 6.27%) in comparison with the control (Figure 3A).
Figure 3.
Induction of apoptotic markers by AM6-36 in HL-60 cells. (A) Effect of AM6-36 on Annexin V-FITC/7-AAD double staining: HL-60 cells were treated with AM6-36 for 24 h. The whole cells were collected, and then further incubated with Annexin V-FITC and 7-AAD. After incubation, cells were analyzed by flow cytometry within 30 min. Data are presented as biparametric dot plots showing fluorescence intensity of Annexin-V FITC (FL-1) versus 7-AAD (FL-3). Dots in the each quadrant represent the cell population containing the information on the status of cell viability: Viable cells in the lower left quadrant (Annexin V− 7-AAD−), the early and late apoptotic cells in the lower and upper right quadrant (Annexin V+ 7-AAD−, and Annexin V+ 7-AAD+), and necrotic cells in the upper left quadrant (Annexin V− 7-AAD+). (B) Effect of AM6-36 on the mitochondrial membrane potential: HL-60 cells were treated with AM6-36 (1 µM) for 24 h and incubated with 100 nM of DiOC6(3) for 30 min at 37 °C. The data are demonstrated as histograms of intensity of fluorescence in FL-1 using a flow cytometer. (C) Effect of AM6-36 on the cleavage of PARP: HL-60 cells were treated with the indicated concentrations of AM6-36 for 24 h, and protein expression was assessed by Western blot analysis.
Apoptosis occurs through two major streams including death receptor-mediated extrinsic and mitochondria-mediated intrinsic pathways.24 A loss of mitochondrial transmembrane electric potential (ΔΨM) has been considered as a critical mediator of apoptosis.25 The most commonly used dyes for measuring ΔΨM are carbocyanines and rhodamines.26 In this study, the changes in ΔΨM by AM6-36 was assessed by staining cells with cationic lipophilic carbocyanine fluorochrome DiOC6(3). As shown in Figure 3B, the control peak is markedly shifted from right to left when treated with AM6-36 (1 µM), which indicated the fluorescent intensity from DiOC6(3) was decreased by treatment. Therefore, treatment of HL-60 cells at the apoptotic concentration of AM6-36 resulted in the decrease of ΔΨM. Mitochondria are central organelles of intrinsic apoptosis, since intrinsic apoptosis is accompanied by an increase in mitochondrial membrane permeability, a decrease in mitochondrial membrane potential, and a subsequent release of cytochrome c. Accordingly, one of the effects of AM6-36 on the induction of apoptosis in HL-60 cells is depolarization of mitochondrial membrane potential.
Since the cleavage of poly(ADP-ribose) polymerase (PARP) is one of markers observed during apoptosis,27 we also examined the protein state of PARP using Western blot analysis. As shown in Figure 3C, PARP mainly exists as a non-cleaved, full length form (116 kDa) in control cells, while cleaved PARP fragments (24 and 89 kDa) were detected in cells treated with 1 or 2 µM AM6-36. Even full length PARP was nearly completely diminished by treatment with 2 µM AM6-36. Cleaved PARP (89kDa) was confirmed using the cleaved form (Asp214)-specific antibody.
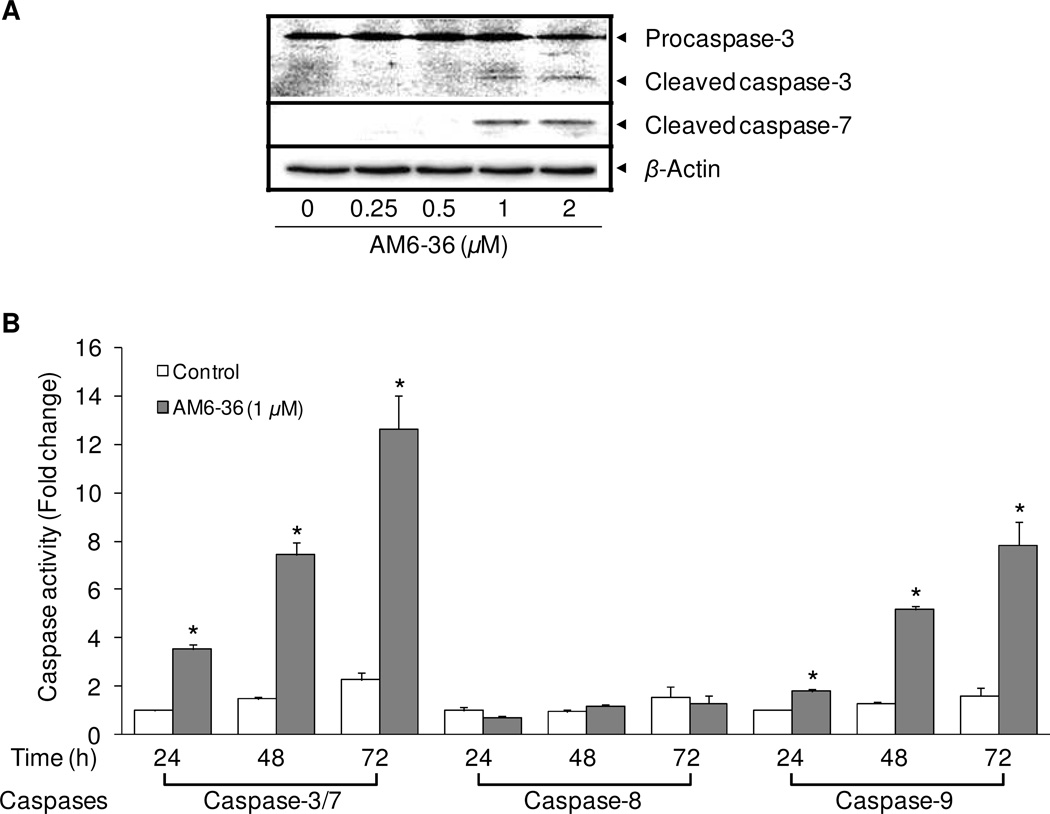
Since the state of the mitochondria is a crucial factor for the activation of caspases,28 and PARP can be cleaved by caspases,29 we investigated the effect of AM6-36 on major caspases. At least 14 types of caspases (cysteine-dependent aspartate-directed proteases) are found in mammals. Some caspases, including caspase-2, -8, -9, and -10 as initiators, and caspase-3, -6, and -7 as effectors, play crucial roles in apoptosis. In general, once initiator caspases are activated, they propagate apoptosis signals to downstream effector caspases by activating them through proteolysis.30 Deregulated expression and activation of caspases caused by genetic alterations, promoter methylation, alternative splicing, and posttranslational modifications are commonly found in various cancer types.31 As shown in Figure 4, only caspase-3 proenzyme or zymogen, which is functionally inactive, was detected in control (untreated) cells. However, AM6-36 induced the cleavage of caspase-3 which leads to the enzymatic activation of caspase-3. Likewise, the protein expression level of cleaved caspase-7 was undetectable in control cells, but increased expression levels were observed in AM6-36-treated cells. Apoptotic cell death correlated well with activation of the caspase cascade (caspase-3, -7, and -9) through cleavage of pro-forms and, thus, formation of cleaved active forms of corresponding active caspases with higher concentrations of AM6-36 (1 or 2 µM). In addition, the enzymatic activities of caspase-3/-7, and -9 were induced by the treatment of AM6-36 up to 12.6 ± 1.4-fold and 7.8 ± 1.0-fold, respectively, while caspase-8, which is involved in the extrinsic pathway of apoptosis, was not affected by treatment (Figure 4). This cascade was activated concomitantly with the apoptosis responses observed with Annexin V/7-AAD and mitochondrial membrane potential (Figure 3).
Figure 4.
Effects of AM6-36 on the expression of caspases. (A) HL-60 cells were treated for 24 h with various concentrations of AM6-36 and protein expression was measured by Western blot analysis. (B) HL-60 cells were treated with serially diluted AM6-36 for 24 h and then incubated with the substrates of caspase-3/-7, caspase-8, or caspase-9. The fold induction in comparison with vehicle (DMSO)-treated control is demonstrated as a bar graph. *P value less than 0.05 is considered statistically significant from control group (white bars) at each time and caspase.
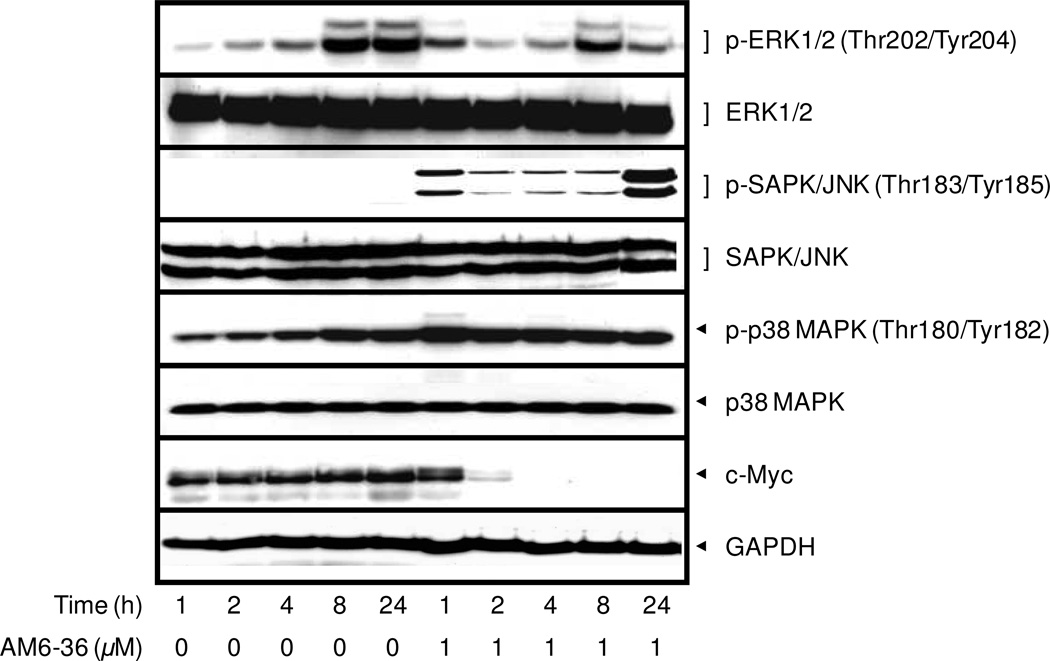
Next, we examined the expression levels of other important signaling molecules. As shown in Figure 5, treatment with AM6-36 did not affect the total expression of each MAPK. However, the phosphorylation levels of JNK and p38 MAPK were enhanced. It has been reported that JNK and p38 can be activated by reactive oxygen species (ROS), and the apoptotic effects of compounds including fucoxanthin, CWJ-081, and shikonin along with ROS generation have been published.32–34 Further investigations along these lines would be of interest.
Figure 5.
Effect of AM6-36 on the expression of MAPKs and c-Myc. HL-60 cells were treated for the indicated times with 1 µM AM6-36, and protein expression was measured by Western blot analysis.
c-Myc as an oncogene is overexpressed in HL-60 cells.35,36 As shown in Figure 5, c-Myc was completely down-regulated by treatment with AM6-36, with significant effects observed as early as 2 h. Since v-myc was identified as a viral oncogene in 1978,37 the cellular homolog of v-myc in human (c-myc) has been studied for diverse roles in homeostasis (under normal conditions) as well as in tumorigenesis. A well-known function of deregulated c-Myc in carcinogenesis is to up-regulate (stimulate, enhance) cell cycle progression and metabolism.38 Also, it was reported that c-Myc indirectly results in increased PARP activity and resistance to DNA-damaging agents.39 Indeed, many cancer cells, including HL-60, have been observed with overexpressed c-Myc levels. Since Myc plays pivotal roles in the fate of cells, the protein levels of Myc is tightly regulated at the transcriptional level by various upstream signaling pathways including Wnt, Ras/Raf/MAPK, JAK/STAT, TGFβ, Notch, Hedgehog, and NF-κB, as well as at the post-transcriptional level by protein stabilization and degradation pathways.36 In fact, there is a correlation between JNK and c-Myc: JNK is an upstream regulator of c-Myc through the phosphorylation and ubiquitination degradation of c-Myc.40 JNK knockdown results in increased c-Myc expression and JNK addition causes c-Myc ubiquitination.41 Therefore, the increased phosphorylation of JNK by AM6-36 (Figure 5) might result in the rapid degradation of c-Myc. Since the protein expression of c-Myc was totally diminished within such a short time (2 h) of AM6-36 treatment, AM6-36 might affect the stability of c-Myc rather than the expression. It has been reported that the phosphorylation of Ser62 residue affects the stabilization of Myc. This phosphorylation recruits the FBW7 ubiquitin E3 ligase that targets the protein for proteasomal degradation by ubiquitinating Myc.42
In sum, as demonstrated previously, AM6-36 induced RXRα transcriptional activity in a COS-1 cell-line based reporter gene assay, and inhibited the growth of human breast cancer cells.13 As currently described, we have examined the effect of AM6-36 on HL-60 cell proliferation as well as cell cycle distribution. Clearly, AM6-36 demonstrated potent inhibition of cell proliferation via accumulation of cells in the subG1 and G2/M phases of the cell cycle. It is known that activation of RXR-RXR homodimer barely affects the growth or differentiation of HL-60 cells.43 Consequently, it is apparent that AM6-36 is capable of functioning by additional mechanisms, some of which are described in this manuscript, such as modulation of MAPKs. Potential value for the treatment of leukemia could reside in pleiotropic mechanisms and the induction of apoptosis.
EXPERIMENTAL SECTION
General Experimental Procedures
Roswell Park Memorial Institute (RPMI) 1640 medium, fetal bovine serum (FBS), 0.05% trypsin-EDTA solution (1x), antibiotic-antimycotic solution (100x), and 3,3'-dihexyloxacarbocyamine [DiOC6(3)] were purchased from Invitrogen Co. (Carlsbad, CA, USA). DMSO, and 3-(4,5-dimethylthiazol-2-yl)-2,5-diphenyl-2H-tetrazolium bromide (MTT) were purchased from Sigma-Aldrich, Inc. (St. Louis, MO, USA). Anti-p53 was purchased from Santa Cruz Biotechnology (Santa Cruz, CA). Cell Lysis Buffer (10x), LumiGLO chemiluminescent detection kit, anti-caspase-3, anti-cleaved caspase-7, anti-poly (ADP-ribose) polymerase (PARP), anti-phospho (p)-p44/42 MAPK (ERK1/2) (Thr202/Tyr204), anti-ERK1/2, anti-p-p38 MAPK (Thr180/Tyr182), anti-p38 MAPK, anti-p-SAPK/JNK (Thr183/Tyr185), anti-SAPK/JNK, anti-c-Myc, anti-GAPDH, and anti-β-actin antibodies were from Cell Signaling Biotechnology (Danvers, MA, USA). Nuclear isolation medium-4',6-diamidino-2-phenylindole (NIM-DAPI), and Annexin V-fluorescein isothiocyanate (FITC)/7-Aminoactinomycin D (7-AAD) kit was purchased from Beckman Coulter, Inc. (Fullerton, CA). Caspase-Glo 3/7 assay, caspase-Glo 8 assay, caspase-Glo 9 assay kits were purchased from Promega (Madison, WI). Enhanced chemiluminescence (ECL) detection kit was purchased from Amersham Biosciences (Piscataway, NJ, USA). AM6-36 was chemically synthesized as described in the previous report.12
Cell Culture
HL-60 human acute promyelocytic leukemia cell line was obtained from the American Type Culture Collection ATCC (Manassas, VA, USA) and was cultured in RPMI 1640 supplemented with 10% heat-inactivated FBS, 100 units/mL penicillin, 100 µg/mL streptomycin, and 250 ng/mL amphotericin B at 37 °C in humidified atmosphere with 5% CO2.
Evaluation of Proliferation Inhibitory Potential (MTT Assay)
Cell viability was estimated by measuring mitochondrial dehydrogenase activity of cells according to method of Mosmann.44 After cells were incubated with serially diluted AM6-36 for the indicated time, MTT solution (a final concentration: 500 µg/mL) was added to each well, and incubated for an additional 4 h. The media were removed from cells, and remaining purple formazan crystal was dissolved in 100% DMSO, and the OD of each well was measured at 540 nm using a microplate reader. The effect of AM6-36 on cell proliferation was calculated as a percentage relative to vehicle-treated control after the subtraction of time zero (the starting point of AM6-36 treatment), and the IC50 values were determined using TableCurve software 2D (version 4) curve-fitting software (Jandel Scientific, Corte Madera, CA).
Analysis of Cell Cycle Distribution of HL-60 cells
Cell cycle distribution was assessed by staining DNA content with NIM-DAPI according to the manufacturer’s instructions. Briefly, after incubation with AM6-36, cells were exposed to NIM-DAPI solution just before the measurement using Cell Lab Quanta SC (Beckman Coulter) flow cytometer. The distribution of cells in each phase of the cell cycle was calculated using ModFit LT 2.0 program (Verity Software House, Topsham, ME).
Analysis of Cell Death: Annexin V-FITC/7-AAD Double Staining
Cells were treated with AM6-36 for 24 h and double-stained with annexin V-FITC and 7-AAD according to the manufacturer’s protocol. Stained cells were diluted with 400 µL of 1×binding buffer and immediately analyzed by Cell Lab Quanta SC flow cytometer (Beckman Coulter, Inc. Fullerton, CA, USA). Data are presented as biparametric, quadrant dot plots showing fluorescence intensity of annexin-V FITC (FL-1 in X-axis) versus 7-AAD (FL-3 in Y-axis).
Measurement of the Activities of Caspase-3/7, 8, and 9 Enzymes
The effect of AM6-36 on the caspase-3/7 enzymatic activities was examined according to the manufacturer’s protocol. After the treatment with AM6-36 in HL-60 cells cultured in a white 96-well plate for 24, 48, and 72 h, 30 µL of substrates of each caspase were added and further incubated for 3 h at room temperature. The luminescence of each well was measured using a luminometer.
Measurement of the Mitochondrial Membrane Potential
HL-60 cells were treated with vehicle (DMSO) or AM6-36 (1 µM) for 96 h. Cells were incubated with 100 nM of DiOC6(3) for 30 min at 37 °C. Cells were washed and resuspended with PBS and immediately analyzed using flow cytometry (FL-1).
Evaluation of the Protein Eexpression by Western Blot Analysis
Cells exposed to various concentrations of AM6-36 and 9-cis-RA for 24 h were lysed and protein concentrations were determined by the Bradford method.45 Total proteins (15 µg) in each cell lysate were subjected to resolution on 12% of sodium dodecyl sulfate-polyacrylamide gel electrophoresis (SDS-PAGE), then electrotransferred onto PVDF membranes. The membranes were incubated for 1 h at room temperature with blocking buffer [5% skimmed milk in Tris-buffered saline-0.1% Tween 20 (TBST)], then further incubated with specific antibodies diluted in 3% skimmed milk in TBS overnight at 4 °C. After washing with TBST three times, membranes were incubated with horseradish peroxidase (HRP)-conjugated secondary antibodies for 2 h at room temperature, and visualized by LumiGLO chemiluminescent detection kit using Geliance 1000 imager (Perkin Elmer).
Statistical Analysis
Data were expressed as means ± standard deviation (SD) for the indicated number of independently performed experiments. Statistical significance between treated and control groups was determined (assessed, calculated) by one-way analysis of variance (ANOVA) using Microsoft Excel 2007 software (Microsoft Corporation, Redmond, Washington). P values less than 0.05 (p < 0.05) were considered statistically significant.
ACKNOWLEDGMENT
This work was supported in part by program project P01 CA48112 awarded by the National Cancer Institute. This work was also supported by the NIH, National Cancer Institute R25CA128770 (D. Teegarden) Cancer Prevention Internship Program (M.C.-S.) administered by the Oncological Sciences Center and the Discovery Learning Research Center at Purdue University.
Footnotes
Dedicated to Dr. Gordon M. Cragg, formerly Chief, Natural Products Branch, National Cancer Institute, Frederick, Maryland, for his pioneering work on the development of natural product anticancer agents.
REFERENCES
- 1.Giri P, Kumar GS. Mini Rev. Med. Chem. 2010;10:568–577. doi: 10.2174/138955710791384009. [DOI] [PubMed] [Google Scholar]
- 2.Singh T, Vaid M, Katiyar N, Sharma S, Katiyar SK. Carcinogenesis. 2011;32:86–92. doi: 10.1093/carcin/bgq215. [DOI] [PMC free article] [PubMed] [Google Scholar] [Retracted]
- 3.Hsu WH, Hsieh YS, Kuo HC, Teng CY, Huang HI, Wang CJ, Yang SF, Liou YS, Kuo WH. Arch. Toxicol. 2007;81:719–728. doi: 10.1007/s00204-006-0169-y. [DOI] [PubMed] [Google Scholar]
- 4.Malikova J, Zdarilova A, Hlobilkova A. Biomed. Pap. Med. Fac. Univ. Palacky. Olomouc. Czech. Repub. 2006;150:5–12. doi: 10.5507/bp.2006.001. [DOI] [PubMed] [Google Scholar]
- 5.Konkimalla VB, Efferth T. Biochem. Pharmacol. 2010;79:1092–1099. doi: 10.1016/j.bcp.2009.11.025. [DOI] [PubMed] [Google Scholar]
- 6.Wang G, Lemos JR, Iadecola C. Trends Pharmacol. Sci. 2004;25:120–123. doi: 10.1016/j.tips.2004.01.009. [DOI] [PubMed] [Google Scholar]
- 7.Wang LK, Johnson RK, Hecht SM. Chem. Res. Toxicol. 1993;6:813–818. doi: 10.1021/tx00036a010. [DOI] [PubMed] [Google Scholar]
- 8.Cushman M, Cheng L. J. Org. Chem. 1978;43:3781–3783. [Google Scholar]
- 9.Antony S, Agama KK, Miao ZH, Takagi K, Wright MH, Robles AI, Varticovski L, Nagarajan M, Morrell A, Cushman M, Pommier Y. Cancer Res. 2007;67:10397–10405. doi: 10.1158/0008-5472.CAN-07-0938. [DOI] [PubMed] [Google Scholar]
- 10.Antony S, Agama KK, Miao ZH, Hollingshead M, Holbeck SL, Wright MH, Varticovski L, Nagarajan M, Morrell A, Cushman M, Pommier Y. Mol. Pharmacol. 2006;70:1109–1120. doi: 10.1124/mol.106.024372. [DOI] [PubMed] [Google Scholar]
- 11.Kim SH, Oh SM, Song JH, Cho D, Le QM, Lee SH, Cho WJ, Kim TS. Bioorg. Med. Chem. 2008;16:1125–1132. doi: 10.1016/j.bmc.2007.10.086. [DOI] [PubMed] [Google Scholar]
- 12. [Accessed 09/05/2011]; http://clinicaltrials.gov/ct2/show/NCT01051635.
- 13.Park EJ, Kondratyuk TP, Morrell A, Kiselev E, Conda-Sheridan M, Cushman M, Ahn S, Choi Y, White JJ, van Breemen RB, Pezzuto JM. Cancer Prev. Res(Phila) 2011;4:592–607. doi: 10.1158/1940-6207.CAPR-10-0004. [DOI] [PMC free article] [PubMed] [Google Scholar]
- 14.Mangelsdorf DJ, Evans RM. Cell. 1995;83:841–850. doi: 10.1016/0092-8674(95)90200-7. [DOI] [PubMed] [Google Scholar]
- 15.Germain P, Chambon P, Eichele G, Evans RM, Lazar MA, Leid M, De Lera AR, Lotan R, Mangelsdorf DJ, Gronemeyer H. Pharmacol. Rev. 2006;58:760–772. doi: 10.1124/pr.58.4.7. [DOI] [PubMed] [Google Scholar]
- 16.Querfeld C, Nagelli LV, Rosen ST, Kuzel TM, Guitart J. Expert Opin. Pharmacother. 2006;7:907–915. doi: 10.1517/14656566.7.7.907. [DOI] [PubMed] [Google Scholar]
- 17.Jemal A, Siegel R, Ward E, Hao Y, Xu J, Thun MJ. CA Cancer J. Clin. 2009;59:225–249. doi: 10.3322/caac.20006. [DOI] [PubMed] [Google Scholar]
- 18.Sherr CJ. Science. 1996;274:1672–1677. doi: 10.1126/science.274.5293.1672. [DOI] [PubMed] [Google Scholar]
- 19.Stewart ZA, Westfall MD, Pietenpol JA. Trends Pharmacol. Sci. 2003;24:139–145. doi: 10.1016/S0165-6147(03)00026-9. [DOI] [PubMed] [Google Scholar]
- 20.Hsiang YH, Lihou MG, Liu LF. Cancer Res. 1989;49:5077–5082. [PubMed] [Google Scholar]
- 21.Fuchs DA, Johnson RK. Cancer Treat Rep. 1978;62:1219–1222. [PubMed] [Google Scholar]
- 22.Martin SJ, Reutelingsperger CP, McGahon AJ, Rader JA, van Schie RC, LaFace DM, Green DR. J. Exp. Med. 1995;182:1545–1556. doi: 10.1084/jem.182.5.1545. [DOI] [PMC free article] [PubMed] [Google Scholar]
- 23.van Engeland M, Ramaekers FC, Schutte B, Reutelingsperger CP. Cytometry. 1996;24:131–139. doi: 10.1002/(SICI)1097-0320(19960601)24:2<131::AID-CYTO5>3.0.CO;2-M. [DOI] [PubMed] [Google Scholar]
- 24.Fulda S, Debatin KM. Oncogene. 2006;25:4798–4811. doi: 10.1038/sj.onc.1209608. [DOI] [PubMed] [Google Scholar]
- 25.Petit PX, Lecoeur H, Zorn E, Dauguet C, Mignotte B, Gougeon ML. J. Cell Biol. 1995;130:157–167. doi: 10.1083/jcb.130.1.157. [DOI] [PMC free article] [PubMed] [Google Scholar]
- 26.Galluzzi L, Zamzami N, de La Motte Rouge T, Lemaire C, Brenner C, Kroemer G. Apoptosis. 2007;12:803–813. doi: 10.1007/s10495-007-0720-1. [DOI] [PubMed] [Google Scholar]
- 27.Kaufmann SH, Desnoyers S, Ottaviano Y, Davidson NE, Poirier GG. Cancer Res. 1993;53:3976–3985. [PubMed] [Google Scholar]
- 28.Wolf BB, Green DR. J. Biol. Chem. 1999;274:20049–20052. doi: 10.1074/jbc.274.29.20049. [DOI] [PubMed] [Google Scholar]
- 29.Soldani C, Scovassi AI. Apoptosis. 2002;7:321–328. doi: 10.1023/a:1016119328968. [DOI] [PubMed] [Google Scholar]
- 30.Rastogi RP, Richa, Sinha RP. EXCLI Journal. 2009;8:155–181. [Google Scholar]
- 31.Ghavami S, Hashemi M, Ande SR, Yeganeh B, Xiao W, Eshraghi M, Bus CJ, Kadkhoda K, Wiechec E, Halayko AJ, Los M. J. Med. Genet. 2009;46:497–510. doi: 10.1136/jmg.2009.066944. [DOI] [PubMed] [Google Scholar]
- 32.Kim KN, Heo SJ, Kang SM, Ahn G, Jeon YJ. Toxicol. In Vitro. 2010;24:1648–1654. doi: 10.1016/j.tiv.2010.05.023. [DOI] [PubMed] [Google Scholar]
- 33.Won SJ, Chung KS, Ki YS, Choi JH, Cho WJ, Lee KT. Bioorg. Med. Chem. Lett. 2010;20:6447–6451. doi: 10.1016/j.bmcl.2010.09.078. [DOI] [PubMed] [Google Scholar]
- 34.Mao X, Yu CR, Li WH, Li WX. Cell Res. 2008;18:879–888. doi: 10.1038/cr.2008.86. [DOI] [PubMed] [Google Scholar]
- 35.Lu JJ, Meng LH, Shankavaram UT, Zhu CH, Tong LJ, Chen G, Lin LP, Weinstein JN, Ding J. Biochem. Pharmacol. 2010;80:22–30. doi: 10.1016/j.bcp.2010.02.016. [DOI] [PubMed] [Google Scholar]
- 36.Westin EH, Wong-Staal F, Gelmann EP, Dalla-Favera R, Papas TS, Lautenberger JA, Eva A, Reddy EP, Tronick SR, Aaronson SA, Gallo RC. Proc. Natl. Acad. Sci. U.S.A. 1982;79:2490–2494. doi: 10.1073/pnas.79.8.2490. [DOI] [PMC free article] [PubMed] [Google Scholar]
- 37.Sheiness D, Fanshier L, Bishop JM. J. Virol. 1978;28:600–610. doi: 10.1128/jvi.28.2.600-610.1978. [DOI] [PMC free article] [PubMed] [Google Scholar]
- 38.Laurenti E, Wilson A, Trumpp A. Curr. Opin. Cell Biol. 2009;21:844–854. doi: 10.1016/j.ceb.2009.09.006. [DOI] [PubMed] [Google Scholar]
- 39.Ganesan S. Sci. Signal. 2011;4 doi: 10.1126/scisignal.2001946. pe15. [DOI] [PubMed] [Google Scholar]
- 40.Noguchi K, Kitanaka C, Yamana H, Kokubu A, Mochizuki T, Kuchino Y. J. Biol. Chem. 1999;274:32580–32587. doi: 10.1074/jbc.274.46.32580. [DOI] [PubMed] [Google Scholar]
- 41.Alarcon-Vargas D, Ronai Z. J. Biol. Chem. 2004;279:5008–5016. doi: 10.1074/jbc.M312054200. [DOI] [PubMed] [Google Scholar]
- 42.Amati B. Proc. Natl. Acad. Sci. U.S.A. 2004;101:8843–8844. doi: 10.1073/pnas.0403046101. [DOI] [PMC free article] [PubMed] [Google Scholar]
- 43.Kizaki M, Dawson MI, Heyman R, Elster E, Morosetti R, Pakkala S, Chen DL, Ueno H, Chao W, Morikawa M, Ikeda Y, Heber D, Pfahl M, Koeffler HP. Blood. 1996;87:1977–1984. [PubMed] [Google Scholar]
- 44.Mosmann T. J. Immunol. Meth. 1983;65:55–63. doi: 10.1016/0022-1759(83)90303-4. [DOI] [PubMed] [Google Scholar]
- 45.Bradford MM. Anal. Biochem. 1976;72:248–254. doi: 10.1006/abio.1976.9999. [DOI] [PubMed] [Google Scholar]


